Figures & data
Table 1. Primers sequences used in qPCR
Figure 1. Downregulated RAD51 in osteoporosis. (a) Microarray analysis was performed to investigate the abnormal expression of mRNAs between the control and osteoporosis groups. Red indicates high levels, and green indicates low levels. (b) The expression levels of RAD51 in the serum of patients with osteoporosis and healthy individuals were determined by qPCR. ***P < 0.001.
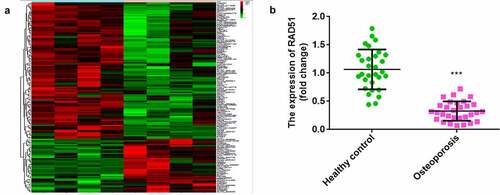
Figure 2. RAD51 promoted osteogenic differentiation. (a) The expression levels of RAD51 in undifferentiated and differentiated cells were determined by qPCR. (b) Transfection efficiency was assessed by qPCR. (c) The effects of RAD51 on ALP activity were assessed by ALP staining. (d) Calcium deposition was assessed by an ARS assay. (e) The expression levels of ALP, RUNX2, and BMP4 were determined using qPCR. (f) The expression levels of ALP, RUNX2, and BMP4 were determined using Western blot. ***P < 0.001. **P < 0.01. *P < 0.05.
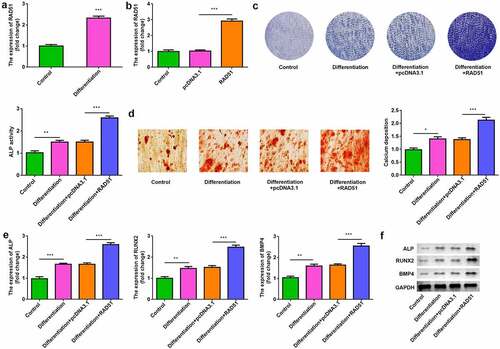
Figure 3. RAD51 suppressed osteoclastogenesis. (a) The expression level of RAD51 was determined in RAW264.7 cells treated with or without RANKL by qPCR. (b) The mRNA expression levels of TRAP, NFATC1, cathepsin K, and Itgb3 were determined using qPCR. (c) The protein expression levels of TRAP, NFATC1, and cathepsin K were determined using Western blot. ***P < 0.001. **P < 0.01. *P < 0.05.
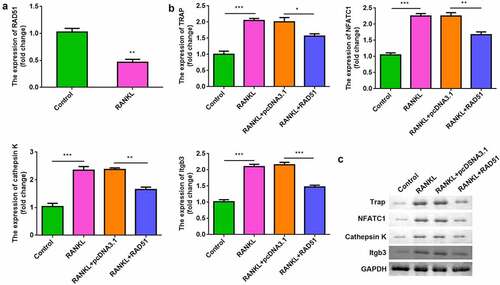
Figure 4. RAD51 level was positively regulated by ATM/ATR signaling. (a) The protein expression levels of p-ATM and p-ATR in the osteoblasts were determined using Western blot. (b) The protein expression levels of p-ATM and p-ATR in the osteoclasts were determined using Western blot. (c) Expression levels of RAD51 in osteoblasts treated with AZ20. (d) Expression levels of RAD51 in osteoclasts treated with AZ20. **P < 0.01.
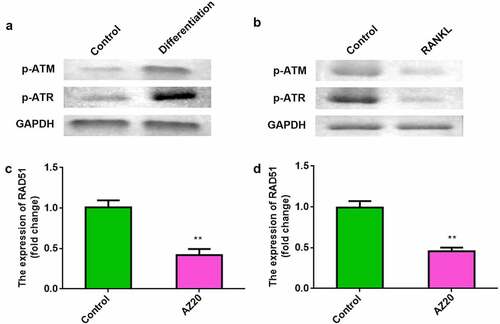
Figure 5. ATM/ATR-RAD51 axis facilitate osteoblastogenesis and suppress osteoclastogenesis. (a) Osteoblastogenesis was assessed by ALP staining assay. (b) Calcium deposition was assessed by an ARS assay. (c) The levels of ALP, RUNX2, and BMP4 were determined by Western blot. (d) The levels of TRAP, NFATC1, and cathepsin K were determined by Western blot. ***P < 0.001. *P < 0.05.
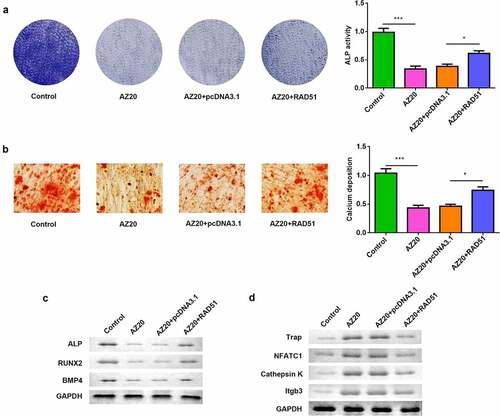
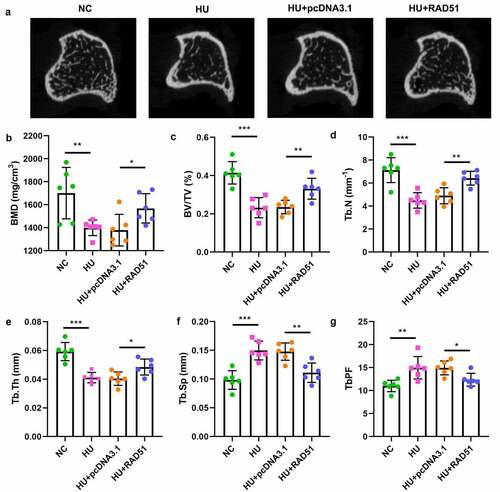
Figure 6. RAD51 suppressed osteoporosis in vivo. (a) The representative micro-CT sectional femoral images. (b-g) The bone microarchitecture parameters, such as BMD, BV/TV, Tb.N, Tb.Th, Tb.Sp, and Tb.PF, were analyzed by micro-CT. ***P < 0.001. **P < 0.001. *P < 0.05.