Figures & data
Table 1. qPCR primers
Figure 1. SNHG16 was poorly expressed upon OGD/R and its overexpression attenuated OSI and cell inflammation post-OGD/R. The cerebral I/R cell model was established with normally cultured SK-N-SH cells as the control. a: SNHG16 expression detected via qRT-PCR; b: Cell proliferation assessed via CCK-8; c: Cell apoptosis assessed via flow cytometry; d: ROS level measured via fluorescence labeling; e-g: LDH, MAD, and SOD activities determined via corresponding assay kits; h: TNF-α, IL-1β, and IL-10 concentrations determined via ELISA. Cell experiments were performed 3 times independently and data were exhibited as mean ± SD. Data in figures A, C, D, E, F, and G were analyzed using one-way ANOVA and data in figures B and H were analyzed using two-way ANOVA, followed by Tukey’s multiple comparison test. * P < 0.05; ** P < 0.01; ***P < 0.001.
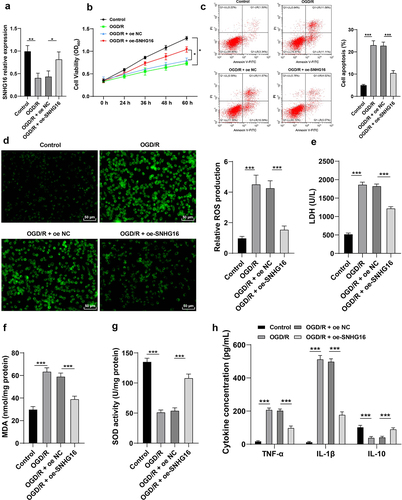
Figure 2. SNHG16 inhibited miR-421 expression. a: Subcellular localization of SNHG16 predicted via the LncATLAS website (http://lncatlas.crg.eu/); b: Subcellular localization of SNHG16 testified via the nuclear/Cytosol fractionation assay; c: Downstream miRNAs of SNHG16 predicted via the LncBase v.2 and Starbase websites, and the Venn diagram was plotted; d-e: The binding of SNHG16 and miR-421 verified via dual-luciferase reporter assay (d) and RNA pull-down assay (e); F: miR-421expression detected via qRT-PCR. Cell experiments were performed 3 times independently and data were exhibited as mean ± SD. Data in figure E were analyzed using t test. Data in figure F were analyzed using one-way ANOVA and data in figure D were analyzed using two-way ANOVA, followed by Tukey’s multiple comparison test. * P < 0.05; ** P < 0.01; ***P < 0.001.
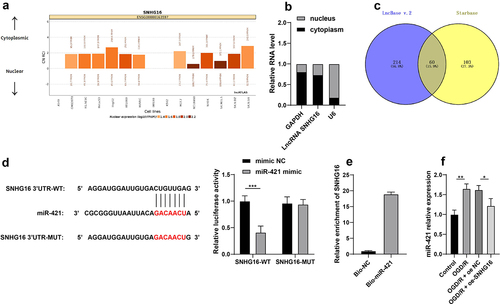
Figure 3. miR-421 upregulation partly reversed the alleviating role of SNHG16 in OSI and cell inflammation post-OGD/R. miR-421 mimic was transfected into oe-SNHG16-treated SK-N-SH cells with mimic NC as the control. a: The transfection efficiency of miR-421 detected via qRT-PCR; b: ROS level measured via fluorescence labeling; c-e: LDH, MAD and SOD activities determined via corresponding assay kits; f: TNF-α, IL-1β, and IL-10 concentrations determined via ELISA. Cell experiments were performed 3 times independently and data were exhibited as mean ± SD. Data in figures A, B, C, D, and E were analyzed using one-way ANOVA and data in figure F were analyzed using two-way ANOVA, followed by Tukey’s multiple comparison test. * P < 0.05; ** P < 0.01; ***P < 0.001.
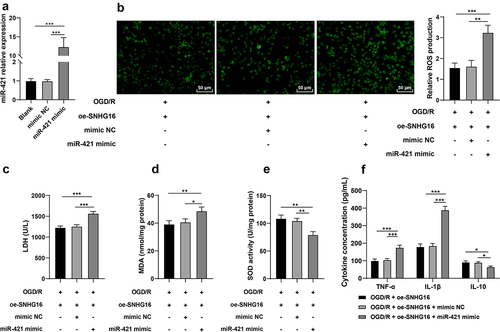
Figure 4. miR-421 inhibited XIAP expression. a: Downstream target genes of miR-421 predicted via the Starbase, TargetScan, RNA22 and miRTarBase websites; b: The binding of miR-421 and XIAP testified via the dual-luciferase reporter assay; c: mRNA and protein levels of XIAP detected via qRT-PCR and Western blotting. Cell experiments were performed 3 times independently and data were exhibited as mean ± SD. Data in figure C were analyzed using one-way ANOVA and data in figure B were analyzed using two-way ANOVA, followed by Tukey’s multiple comparison test. * P < 0.05; ** P < 0.01; ***P < 0.001.
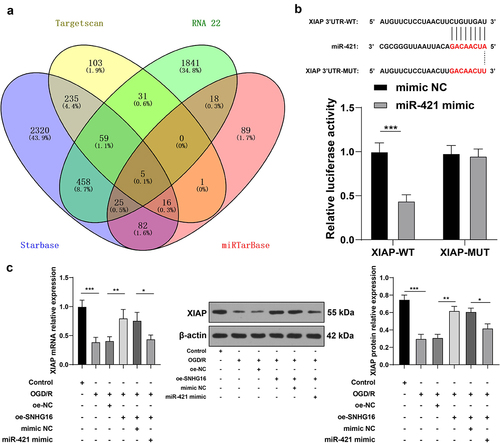
Figure 5. Silencing XIAP partly reversed the alleviating role of SNHG16 in OS injury and cell inflammation post-OGD/R. SK-N-SH cells were transfected with si-XIAP-1 and XIAP-2 with si-NC as the control. a: The transfection efficiency of si-XIAP-1 and XIAP-2 detected via qRT-PCR and Western blotting; si-XIAP-1 with better transfection efficacy was selected to do joint experiments with oe-SHNG15; b: ROS level measured via fluorescence labeling; c-e: LDH, MAD, and SOD activities determined via corresponding assay kits; F: TNF-α, IL-1β, and IL-10 concentrations determined via ELISA. Cell experiments were performed 3 times independently and data were exhibited as mean ± SD. Data in figures A, B, C, D, and E were analyzed using one-way ANOVA, and data in figure F were analyzed using two-way ANOVA, followed by Tukey’s multiple comparison test. * P < 0.05; ** P < 0.01; ***P < 0.001.
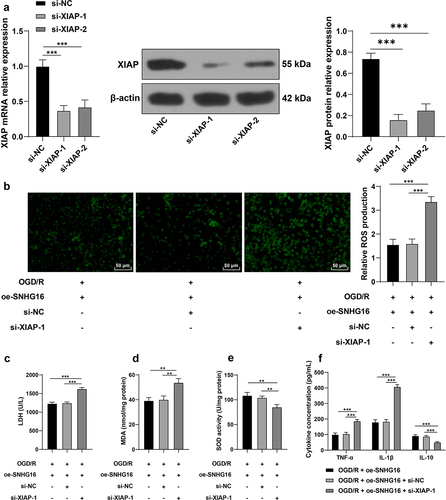
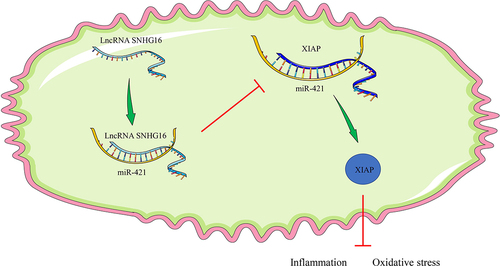
Figure 6. Mechanism of SNHG16 in OS injury and cell inflammation post-OGD/R. SNHG16 comparatively bound to miR-421 to inhibit the binding of miR-421 and XIAP and to further facilitate XIAP expression, thereby attenuating OS injury and cell inflammation post-OGD/R.