
Figures & data
Figure 1. Evaluation of the intracellular trafficking of EGF/EGFR.a. Analysis of EGFR expression on HUVECs. b. HUVECs were seeded onto the glass coverslips and cultured for 12 h. After three washes with PBS, the cells were fixed with 4% PFA for 10 min at 37°C. After washing, the cells were then permeabilized with 90% ice-cold methanol for 15 min at −20°C. The cells were then incubated with 5% BSA to block cell samples. The cells were then treated with the indicated anti-EGFR antibody(Abcam, #ab52894, 1:200 dilution). After three washes, the cells were incubated with secondary antibody (IgG H&L (Alexa Fluor® 488), #ab150077, 1:1000 dilution). After three washes, the cell samples were detected by CLSM (Leica-STELLARIS). b. Internalization of EGF in HUVECs. HUVECs were seeded on the glass coverslips and cultured for 12 h. After the cells were cultured in serum-free medium for another 6 h. The HUVECs were incubated with EGF (30 ng/mL) for various time periods. AfterEGF treatment, the cells were fixed and cell nuclei were stained with DAPI. c. The subcellular localization of EGF in HUVECs was analyzed by Western-blot. d. HUVECs were challenged with EGF (30 ng/mL) for 0–120 min. After EGF exposure, the cells were fixed with 4% PFA and permeabilized with 0.5%triton X-100. After blocking with 5% BSA, the cells were labeled with a rabbit monoclonal antibody against EGFR (1:200 in PBST containing 4% BSA) overnight at 4°C. a fluorescently conjugated goat anti-rabbit IgG was used as the secondary antibody to stain the cells. The cells were observed by CLSM. e. The subcellular localization of EGFR in HUVECs was analyzed by Western-blot. Data are presented as mean ± SD (n = 5).
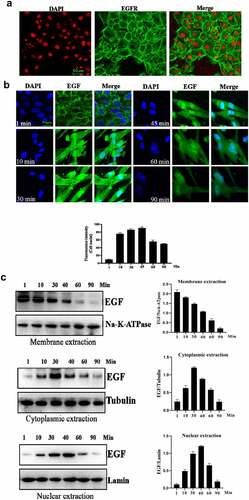
Figure 1b. Continue
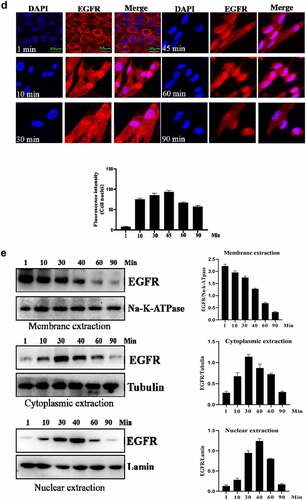
Figure 2. Analysis of the endocytosis of EGF/EGFR. a. EGFR’s endocytosis was mediated via clathrin and/or caveolin by co-localization and IP-WB analysis. b. NUP358 knock-down inhibited the EGFR’s nuclear localization. c.NUP358 knock-down did not affect the EGFR expression pattern and EGFR expression level. d. NUP-358 knockdown did not affect the internalization and cytoplasmic transport of EGF/EGFR. e. Knockdown of NUP-358 had no effect on HUVEC viability by MTT analysis. Data are presented as mean ± SD (n = 5). Asterisks indicate statistically significant differences.
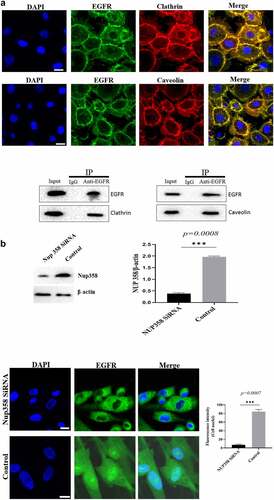
Figure 2b. Continue
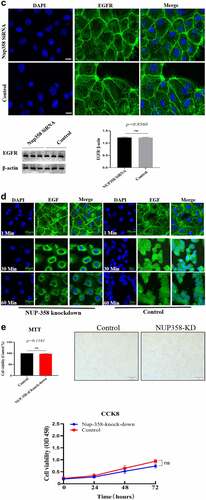
Figure 3. Evaluation of the biological activity of nuclear EGFR. a. HUVEC proliferation were significantly reduced in non-EGFR nuclear localization group by MTT analysis. b. The nuclear-localized EGFR is involved in the cell cycle. c. the expression of cyclinD1, CDK4, Ki67 and Rb were down-regulated.Data are presented as mean ± SD (n = 5). Asterisks indicate statistically significant differences.
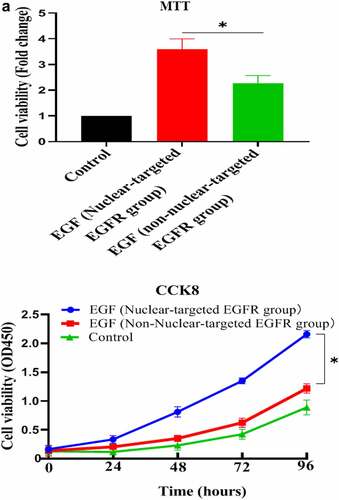
Figure 3b. Continue
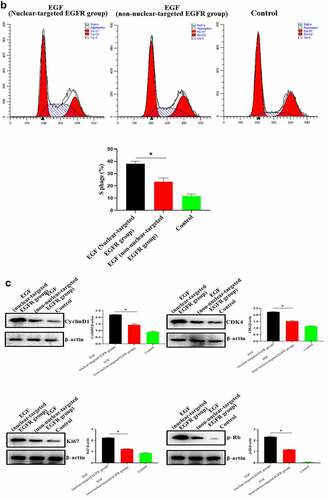
Figure 4. Evaluation of the biological activity of nuclear EGFR. a. Physiological concentration of UA (5 mg/dl) has no effect on the EGF-induced HUVEC proliferation. The cells were pre-treated with high UA (10 mg/dl) or physiological concentration of UA (5 mg/dl) for 24 h, after which, the cell proliferation was analyzed by MTT according to the manufacturer’s instructions. b. EGF-induced expression of cyclinD1, p-Rb, Ki67 and CDK4 was also significantly reduced by high concentration of uric acid(10 mg/dl). c. high concentration of UA (10 mg/dl) severely disrupted the signaling of EGF/EGFR in HUVEC cells model. d. UA (10 mg/dl) inhibited the nuclear localization of EGFR. Data are presented as mean ± SD (n = 5).Asterisks indicate statistically significant differences.
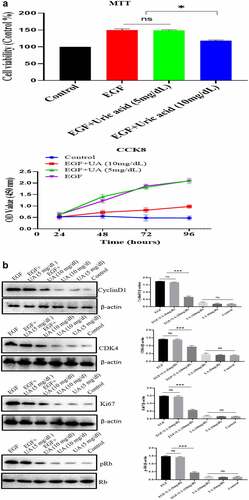
Figure 4b. Continue
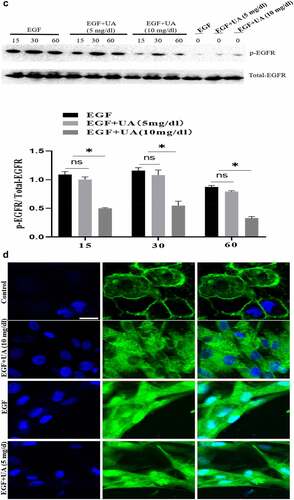
Figure 5. Effect of UA on the HUVEC senescence. a. High concentration of UA induced HUVEC senescence by detecting aging-related markers. b. Ki67 expression was down-regulated by high concentration of UA (10 mg/dl) treatment. c. High concentration of UA (10 mg/dl) increased the expression of inflammatory genes. d. High UA (10 mg/dl) caused the oxidative stress of HUVEC. E-F. High UA caused cell apoptosis and cell cycle changes. The experimental process has been described in detail in Materials and Methods section. Data are presented as mean ± SD. Asterisks indicate statistically significant differences.
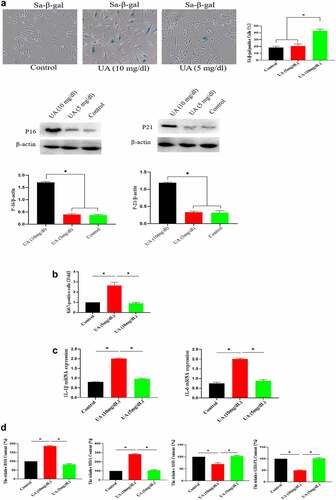
Figure 5b. Continue
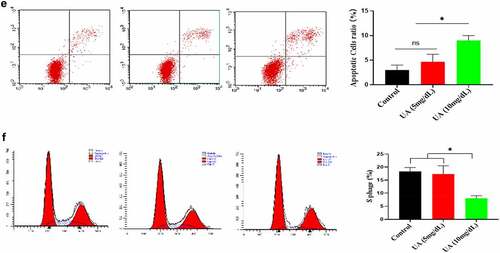
Figure 6. Effect of UA on biological activity of EGF/EGFR. a. Physiological concentration of UA (5 mg/dl) relieved the senescent HUVEC induced by H2O2 treatment. b-c. UA (5 mg/dl) down-regulated H2O2-induced oxidative stress and inflammation. d. physiological concentration of UA (5 mg/dl)restored the signaling ability of EGF/EGFR in senescent HUVEC. Data are presented as mean ± SD. Asterisks indicate statistically significant differences.
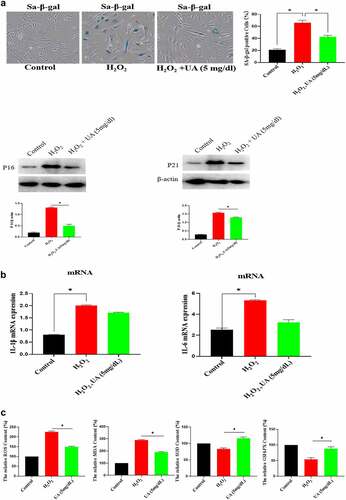
Figure 6b. Continue
Supplemental Material
Download Zip (2 MB)Data availability statement
All data canbe obtained by corresponding author upon the reasonable request.