
Figures & data
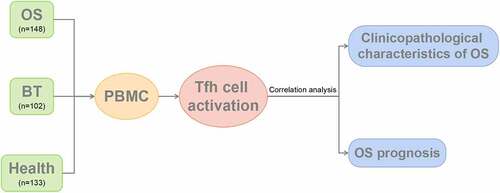
Figure 1. Flow diagram of study design.

Table 1. Comparison of baseline information
Figure 2. Expression of CD4+CXCR5+ Tfh cells in peripheral blood mononuclear cells (a) Flow cytometry-based measurement of expression of CD4+CXCR5+ Tfh cells in peripheral blood mononuclear cell (PBMCs); (b)Proportion of CD4+CXCR5+ Tfh cells in CD4+ T cells. **P < 0.01; ***P < 0.001.
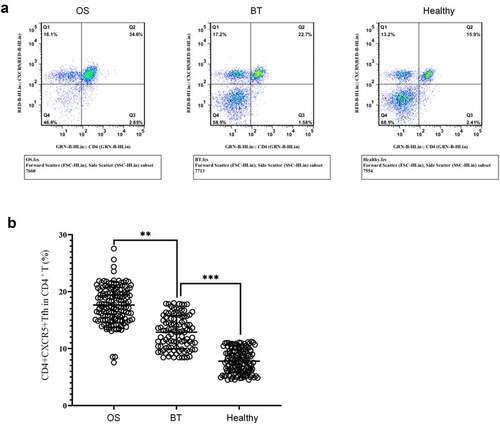
Figure 3. Expression of CD4+CXCR5+CD69+ cells in the peripheral blood (a-c) Flow cytometry-based measurement of expression of CD4+CXCR5+CD69+ cells in peripheral blood mononuclear cell (PBMCs) in the OS group (a), BT group (b), and Healthy group (c); (d) Proportion of CD4+CXCR5+CD69+ cells in CD4+ T cells. ***P < 0.001.
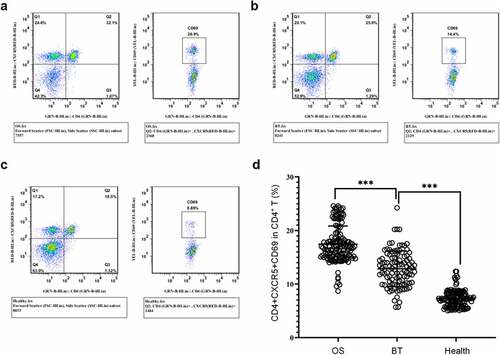
Figure 4. Correlation analysis between the activity level of Tfh cells and clinicopathological characteristics of osteosarcoma. (a) Tumor location; (b) Tumor size; (c) Tumor stage; (d) Tumor differentiation; (e) Presence or absence of distant metastasis. ***P < 0.001; ns, no significant.
Figure 5. Kaplan-Meier survival curve. Overall survival of osteosarcoma patients with high versus low activation levels of Tfh cells in peripheral blood.
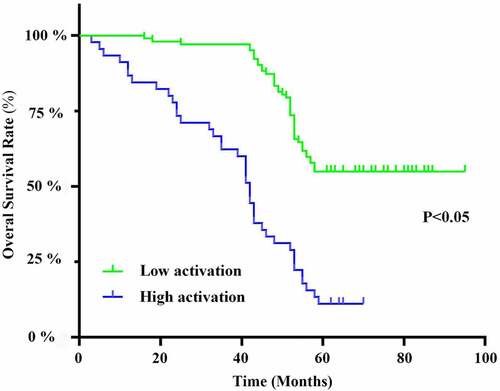
Table 2. Univariate and multivariate Cox analysis of overall survival in osteosarcoma patients