Figures & data
Table 1. Primers used for RT-PCR
Figure 1. Network pharmacology analysis of dapagliflozin, metformin and vildagliptin treatment of DKD (a)-(c) KEGG pathway analysis for the predicted target genes of different drugs on DKD using DisGeNET database and Venny analysis (a. dapagliflozin, b. metformin, c. vildagliptin). (d)-(f) Identification of hub genes for the predicted target genes of different drugs on DKD using cytoscape 3.7.1 software (d. dapagliflozin, e. metformin, f. vildagliptin). Color shade represent the degree of correlation. DAPA: dapagliflozin, MET: metformin, VIL: vildagliptin.
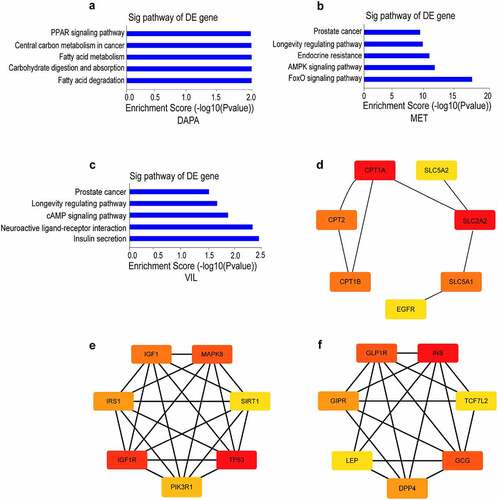
Figure 2. CircRNA and mRNA expression profiles in HK-2 cell treated with dapagliflozin, metformin, or vildagliptin (a)-(d) The volcano plot of differentially expressed circRNAs (a. HG vs NG, b. dapagliflozin vs HG, c. metformin vs HG, d. vildagliptin vs HG) (Fold-change > 1.0 and P-value < 0.05). (e)-(h) Cluster analysis of differentially expressed circRNAs (e. HG vs NG, f. dapagliflozin vs HG, g. metformin vs HG, h. vildagliptin vs HG) (Fold-change > 1.0 and P-value < 0.05). (i)-(j) Validation of randomly selected circRNAs using RT-PCR. *P < 0.05, **P < 0.01, ***P < 0.001, NS: not significant. NG: normal glucose, HG: high glucose, DAPA: dapagliflozin, MET: metformin, VIL: vildagliptin.
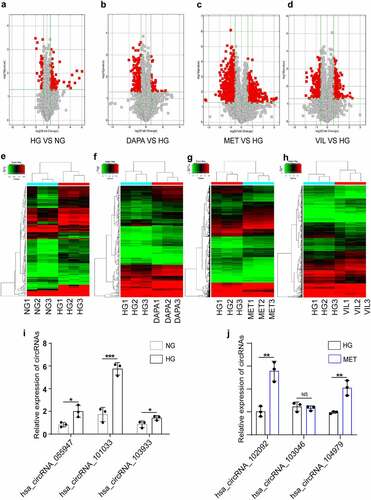
Figure 3. Functional analyses of the parental linear transcripts for differentially expressed circRNAs (a)-(d) GO annotation of the parental linear transcripts for differentially expressed circRNAs (a. HG vs NG, b. dapagliflozin vs HG, c. metformin vs HG, d. vildagliptin vs HG). (e)-(h) KEGG pathway analysis of the parental linear transcripts of differentially expressed circRNAs (e. HG vs NG, f. dapagliflozin vs HG, g. metformin vs HG, h. vildagliptin vs HG). NG: normal glucose, HG: high glucose, DAPA: dapagliflozin, MET: metformin, VIL: vildagliptin.
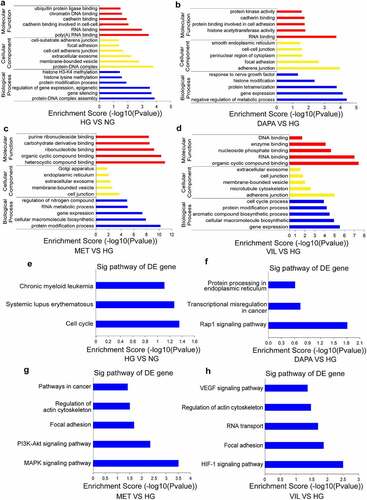
Figure 4. Functional analyses of genes co-regulated by dapagliflozin, metformin, and vildagliptin (a)-(b) Venny diagram analysis of differentially expressed circRNAs co-regulated by dapagliflozin, metformin, and vildagliptin. (c)-(d) Venny diagram analysis of differentially expressed mRNAs co-regulated by dapagliflozin, metformin and vildagliptin. (e)-(f) Validation of the up-regulated and down-regulated circRNAs in the HG group compared with the dapagliflozin, metformin and vildagliptin groups using RT-PCR. (g)-(h) Validation of the up-regulated and down-regulated mRNAs in the HG group compared with the dapagliflozin, metformin and vildagliptin groups using RT-PCR. (i)-(j) GO (i) and KEGG pathway (j) analysis for differentially expressed mRNAs co-regulated by dapagliflozin, metformin and vildagliptin. (k) Identification of the hub genes of differentially expressed mRNAs co-regulated by dapagliflozin, metformin and vildagliptin with cytoHubba in Cytoscape 3.7.1 software. (l)-(m) Validation of the hub genes of differentially expressed mRNAs co-regulated by dapagliflozin, metformin and vildagliptin using RT-PCR. NG: normal glucose, HG: high glucose, DAPA: dapagliflozin, MET: metformin, VIL: vildagliptin. Color shade represent the degree of correlation.
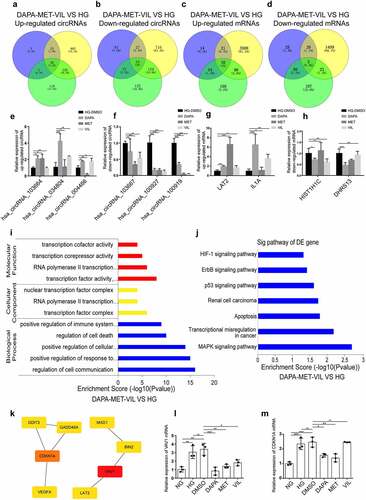
Table 2. Top seven significantly up-regulated and down-regulated circRNAs by microarray analysis
Figure 5. Exploration of the relationship between the key circRNAs and their target genes related to dapagliflozin (a) Validation of the dysregulated circRNAs in the HG group compared with the NG group. (b) Validation of the dysregulated circRNAs in the dapagliflozin group compared with the HG group. (c) The circRNA-mRNA interaction network of differentially expressed circRNAs in the NG, HG, and dapagliflozin group. *P < 0.05, **P < 0.01, ***P < 0.001. The triangle nodes represent differentially expressed circRNAs. The round nodes represent circRNA related genes. Solid lines represent positive correlation, dotted lines represent negative correlation. NG: normal glucose, HG: high glucose, DAPA: dapagliflozin.
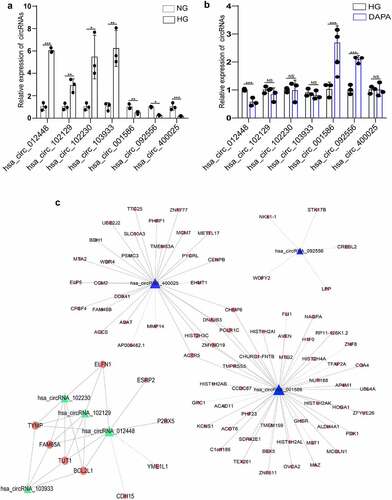
Figure 6. Establishment of the circRNA–miRNA–mRNA network (a) Establishment of the hsa_circRNA_001586-miRNA-mRNA network. (b) Establishment of the hsa_circRNA_012448-miRNA-mRNA network. The triangle nodes represent circRNAs. The rectangle nodes represent the hub miRNAs. The round nodes represent miRNAs target genes.
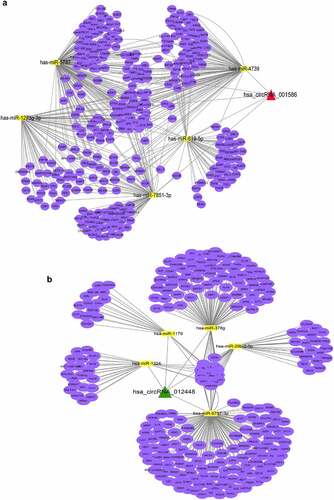
Figure 7. Identification of the hub genes in the ceRNA networks involved in the protective effects of dapagliflozin on DKD (a) Validation of the top five hub miRNAs associated with hsa_circRNA_001586 in the NG, HG, and dapagliflozin group by RT‐PCR. (b) Validation of the top five hub miRNAs associated with hsa_circRNA_012448 in the NG, HG, and dapagliflozin group by RT‐PCR. (c) The hub genes of the hsa_circRNA_001586-miRNA-mRNA network. (d) The expression of VEGFA in the NG, HG, and dapagliflozin groups by RT‐PCR. (e) The hub genes of the hsa_circRNA_012448-miRNA-mRNA network. (f) The expression of GSK3β in the NG, HG, and dapagliflozin groups by RT‐PCR. *P < 0.05, **P < 0.01, ***P < 0.001. NG: normal glucose, HG: high glucose, DAPA: dapagliflozin. Color shade represent the degree of correlation.
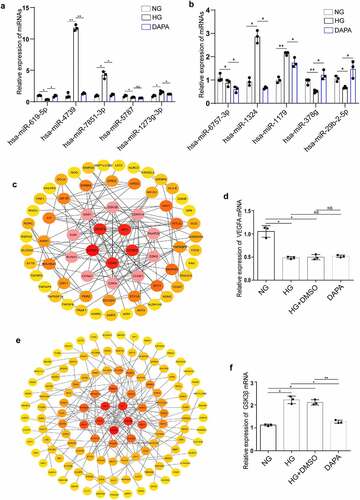
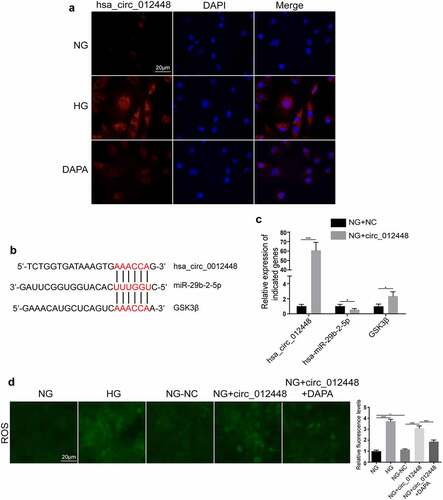
Figure 8. Hsa_circRNA_012448-hsa-miR-29b-2-5p-GSK3β was identified as an important pathway mediating the action of dapagliflozin against DKD (a) Distribution of hsa_circRNA_012448 in HK-2 cells by FISH assay. Scal bar: 20 μm. (b) The predicted binding sites between hsa_circRNA_012448, hsa-miR-29b-2-5p and GSK3β. (c) The expression of hsa_circRNA_012448, hsa-miR-29b-2-5p, and GSK3β in the hsa_circRNA_012448 overexpressing HK-2 cells. (d) Overexpression of hsa_circRNA_012448 increased the production of ROS in HK-2 cells, whereas dapagliflozin inhibited the generation of ROS. Scal bar: 20 μm. *P < 0.05, **P < 0.01, ***P < 0.001, NS: not significant. NC: normal controls; DKD: diabetic kidney disease. FISH: fluorescence in situ hybridization; ROS: reactive oxygen species; NG: normal glucose, HG: high glucose, DAPA: dapagliflozin.