
Figures & data
Figure 1. Differentially expressed mRNAs between osteosarcoma cell and mesenchymal stem cells. (a-b) The mRNA Volcano plot based on (a) GSE70414 data and (b) GSE42352 data. The red points designate upregulated genes screened as per |fold change|>1.0 and p < 0.05. The green points designate downregulated genes screened as per |fold change|>1.0 and p < 0.05. The gray points show genes with no statistically remarkable difference. (c) Venn diagrams of the overlapping DEGs between the two datasets. (d) Protein-protein interaction (PPI) networks for 92 differentially co-expressed genes. Green and blue nodes denote upregulated and downregulated genes, respectively. (e) Heat map showing 92 differentially co-expressed genes, with blue to red colors representing mRNA expression levels from low to high. (f) 23 valuable genes screened based on literature search. Blue, red, and green circles indicate genes that are rarely reported with osteosarcoma (<5), genes with more reported tumors (>10), and genes with the opposite trend of tumor reports, respectively.
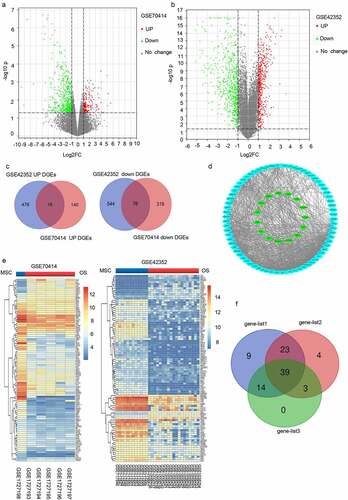
Figure 2. The mRNA expression levels of five genes screened from 23 valuable genes. (a) Normalized gene expression levels of the five screened genes in osteoblasts (OB) and osteosarcoma biopsies (Biopsies). (b) The prognostic value of mRNA contents of the five screened genes in osteosarcoma patients (UCSC). (c) Transcription levels of the five screened genes in different types of cancers (Oncomine).
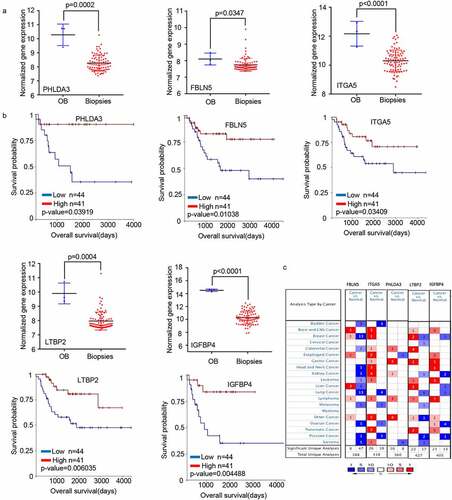
Figure 3. PHLDA3 suppressed the proliferation of human osteosarcoma cell lines. (a) Relative protein and mRNA contents of PHLDA3 in 143B/U2OS cells after transfection with OE-PHLDA3, as confirmed using Western blot and RT-PCR. (b-c) Cell growth ability of 143B/U2OS cells after transfection based on colony formation assays. (d-e) Tumor-initiating capability of 143B cells after transfection, as assessed using sphere formation assay. (f) Cell viability of 143B cells after transfection based on MTT assays. (g) Knockdown efficiency of PHLDA3 using shRNA lentivirus. PHLDA3 expression levels in PHLDA3 knockdown (shPHLDA3-1 and shPHLDA3-2) and negative control cells, as detected using Western blot and RT–PCR. (h-i) Colony formation assays. (j) MTT assays. (k-l) Sphere formation assay. (m) The tumor size of nude mice. (n) Tumor weighs of Xenograft tissues. The data in (c), (e), (F), (i), (J), (l) and (N)were given as means ± SD, *p < .05, **p < .01, ***p < .001 vs. control.
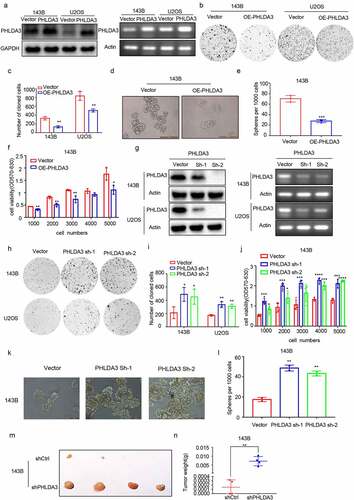
Figure 4. PHLDA3 suppressed cell migration in osteosarcoma. (a-d) Overexpression of PHLDA3 in 143B/U2OS cells via lentivirus vectors. The influences of PHLDA3 on cell migration were explored via Transwell assay (a-b) along with wound-healing assay (c-d). (e-h) PHLDA3 knockdown in 143B/U2OS cells, as well as its influence on cell migration were explored via Transwell assay (e-f) along with wound-healing assay (g-h). The data in (b), (d), (f), and (h) were given as means ± SD, **p < .01, ***p < .001 vs. control.
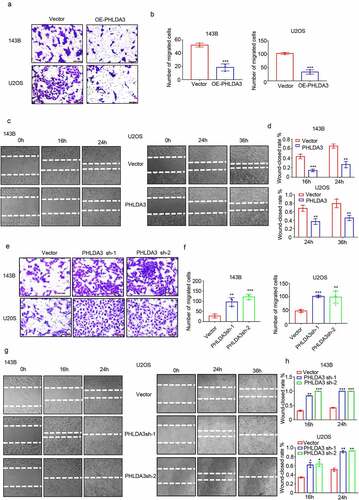
Figure 5. PHLDA3 enhanced cisplatin-triggered apoptosis in osteosarcoma cells. (a) The transfected 143B cells were exposed to different doses of cisplatin (CDDP) for 24 hours, and cells viability was explored via the MTT assay. (b-g) Osteosarcoma cells were inoculated with diverse levels of CDDP for 24 hours after OE-PHLDA3 transfection. Cell apoptosis was analyzed using Western blotting analysis of PARP (b-c), PI only staining (d-e), and Annexin V/PI double staining (f-g). (h) The transfected 143B cells were exposed to diverse levels of CDDP for 24 hours, and cells viability was explored via the MTT assay. (i-l) Osteosarcoma cells were inoculated with diverse levels of CDDP for 24 hours after Sh-PHLDA3 transfection. Cell apoptosis was analyzed using Western blotting analysis of PARP (i-j) and PI only staining (k-l). The data in (e), (f), and (l) were given as means ± SD, ***p < .001 vs. control.
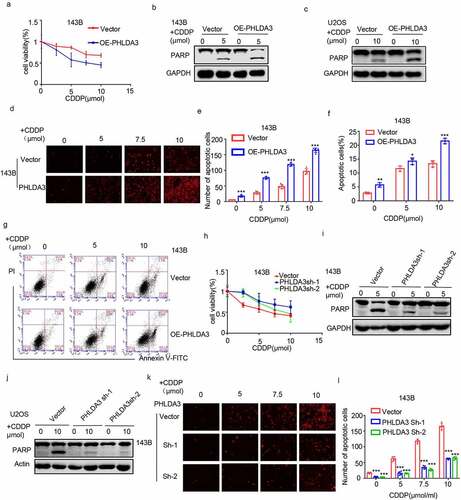
Figure 6. Akt/ GSK-3β signaling cascade is regulated by the expression of PHLDA3. (a-d) Western blots for Akt, GSK-3β, p-Akt along with p-GSK-3β protein contents in 143B/U2OS cells after transfection. (e) Protein contents of Akt, GSK-3β, p-Akt, and p-GSK-3β in 143B cells after inoculation with PHLDA3 downregulation and/or LY294002 (20 μmol) for 24 h. (f-g) The proliferation of 143B cells after treatment with PHLDA3 downregulation and/or LY294002 (20 μmol) examined using a colony formation assay. (h-i) The migration of 143B cells after treatment with PHLDA3 downregulation and/or LY294002 (μmol) examined using Transwell assays. The data in (g) and (i) were given as means ± SD, ***p < .001 vs. control.
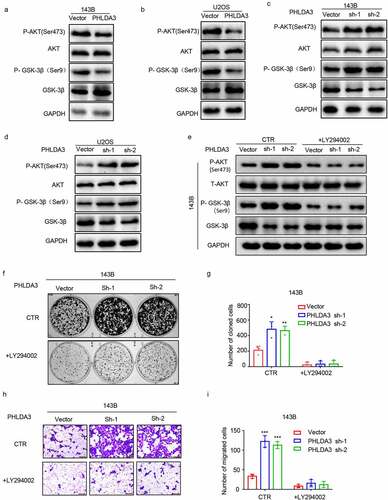
Figure 7. PHLDA3 was a direct target of miR-19a-3p. (a) The candidate PHLDA3 miRNAs as predicted using online databases (ENCORI, TargetScan, and Tarbase). (b) The binding sites of PHLDA3 and miR-19a-3p as predicted by online TargetScan software. (c) High miR-19a-3p gene expression predicted a poorer survival outcome for sarcoma patients, as shown by the ENCORI software analysis. (d) Negative relationship of miR-19-3p content with PHLDA3 levels computed from sarcoma samples. (e-f) MiR-19a-3p inversely modulated PHLDA3 expression in 143B/U2OS cell lines, as explored via Western blot. (g) Schematic illustration of luciferase reporters harboring the wild-type docking site of miR-19a-3p on PHLDA3, named PHLDA3 wild type (PHLDA3 WT), and the mutant docking site, named PHLDA3 Mut. (h-k) PHLDA3 WT or Mut together with the miR-19a-3p mimics or inhibitor were transfected into 143B/U2OS cells. Luciferase activity was explored.
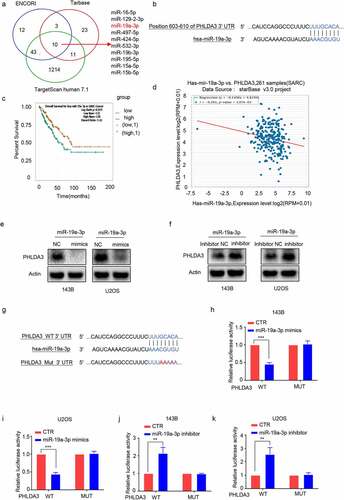
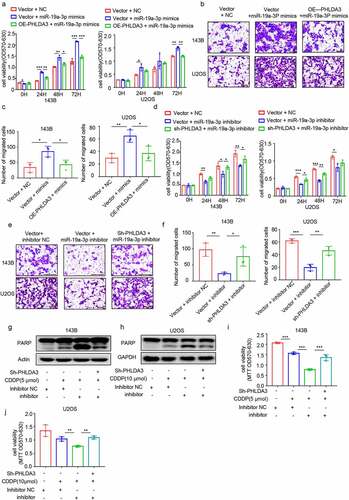
Figure 8. MiR-19a-3p exerted its role on cell proliferation, metastasis, and chemo-sensitivity via dampening PHLDA3 expression. (a-c) The 143B/U2OS cells were inserted with miR-19a-3p mimic or NC via transfection for 24 h. (a) Cell viability based on MTT. (b-c) The migration of osteosarcoma cells examined using Transwell assays. (d-f) The 143B/U2OS cells were inserted with miR-19a-3p inhibitor or inhibitor NC via transfection for 24 h. (d) Cell viability based on MTT. (e-f) The migration of 143B/U2OS cells as explored via Transwell assay. (g-j) Transfected 143B/U2OS cells were untreated or inoculated with cisplatin (CDDP) for 24 h. Cell apoptosis was analyzed using Western blotting analysis of PARP (g-h) and MTT (i-j). The data in (A), (c), (D), (f), (i), and (j) were given as means ± SD, *p < .05, **p < .01, ***p < .001 vs. control.
Data availability statement
Data will be made available on request to the corresponding authors (http://dx.doi.org/10.1080/21655979.2022.2031404).