Figures & data
Figure 1. The upregulated expression level of PVT1 was observed in ALL. (a) qRT-PCR analysis for PVT1 expression level in plasma samples from ALL and healthy controls. **P< 0.01 compared to control. (b) PVT1 expression level in ALL Jurkat and SUP-B15, as well as PBMC. **P< 0.01 compared to PBMC. (c) Jurkat and SUP-B15 cells were transfected with sh-NC or sh-PVT1. The relative expression level of PVT1 after transfection was detected using the qRT-PCR assay. (d-e) The proliferation of Jurkat and SUP-B15 cells was detected by a CCK-8 assay. (f) Colony formation analysis of colony formation in Jurkat and SUP-B15 cells. (g) Cell apoptosis assay for transfected Jurkat and SUP-B15 cells. (h) Jurkat and SUP-B15 cells were transfected with pcDNA3.1-Vector or pcDNA3.1-PVT1. The relative expression level of PVT1 after transfection was detected using the qRT-PCR assay. (i) Colony formation analysis of colony formation in Jurkat and SUP-B15 cells. **P< 0.01 compared to pcDNA3.1-Vector.
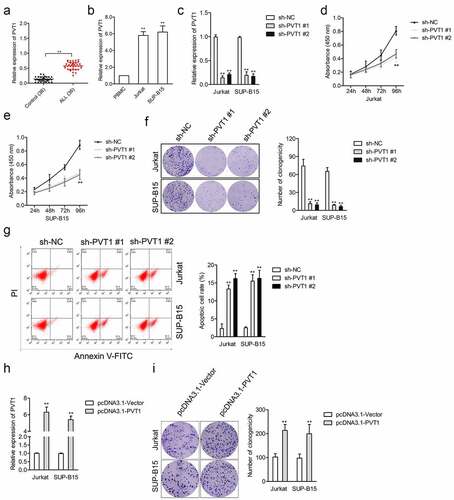
Figure 2. LncRNA PVT1 directly targeted miR-486-5p. (a) The predicted binding site of miR-486-5p and PVT1 and the mutant. (b) Luciferase reporter assays for Jurkat and SUP-B15 cells transfected with PVT1-wt reporter or PVT1-mut reporter, as well as miR-486-5p mimics. (c) The expression of miR-486-5p in plasma samples from ALL and healthy controls. (d) MiR-486-5p expression in ALL Jurkat and SUP-B15 cells, as well as PBMC. (e) Pearson correlation analysis for the correlation between relative expression levels of PVT1 and miR-486-5p in ALL. (f) qRT-PCR assay for miR-486-5p expression in Jurkat and SUP-B15 cells transfected with pcDNA3.1-PVT1 or pcDNA3.1. (g) Jurkat and SUP-B15 cells were transfected with miR-NC or miR-486-5p mimics. The relative expression level of miR-486-5p after transfection were detected using the qRT-PCR assay. (h) Colony formation analysis of colony formation in Jurkat and SUP-B15 cells. (i) Flow cytometry analysis of cell apoptosis in Jurkat and SUP-B15 cells. **P< 0.01 compared to sh-NC or pcDNA3.1.
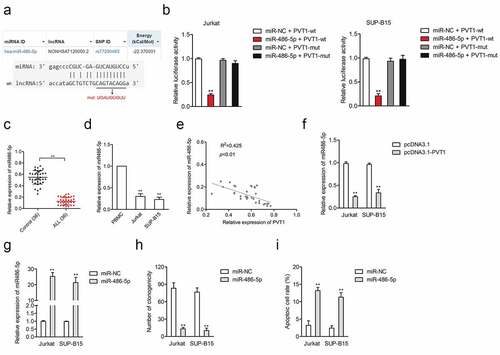
Figure 3. MiR-486-5p targeted and negatively regulated MAML3. (a) The putative binding site of miR-486-5p on 3ʹ-UTR of MAML3 was predicted by miRanda, RNA22, and TargetScan bioinformatics tools. (b) Luciferase reporter assays for Jurkat and SUP-B15 cells transfected with MAML3-wt reporter or MAML3-mut reporter, as well as miR-486-5p mimics. (c) The expression of MAML3 in plasma samples from ALL and healthy controls. (d) The expressions of MAML3 in Jurkat and SUP-B15 cells, as well as PBMC, were detected by Western blotting. (e-f) Pearson correlation analysis for the correlation between relative expression levels of MAML3 and PVT1, miR-486-5p in ALL. (g) The expressions of MAML3 in miR-486-5p transfected Jurkat and SUP-B15 cells were detected by Western blotting. (h) Jurkat and SUP-B15 cells were transfected with si-NC or si-MAML3. The relative expression level of MAML3 after transfection was detected using the qRT-PCR assay. (i) The proliferation of Jurkat and SUP-B15 was detected using CCK-8. (j) The apoptosis of Jurkat and SUP-B15 were measured using flow cytometry analysis. **P< 0.01 compared to si-NC.
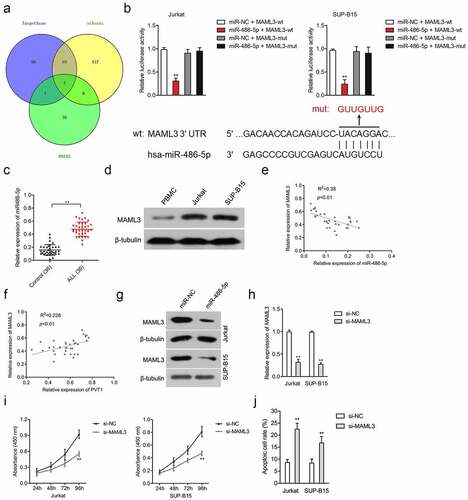
Figure 4. PVT1 regulated the cell viability and apoptosis of ALL cells through regulating miR-486-5p. (a) Jurkat and SUP-B15 cells were transfected with miR-NC, miR-486-5p, or miR-486-5p + pcDNA3.1-PVT1. The expression of MAML3 was determined by Western blot. (b) CCK-8 assay for transfected Jurkat and SUP-B15 cells. (c) Colony formation analysis of colony formation in Jurkat and SUP-B15 cells. (d) The apoptosis of Jurkat and SUP-B15 cells after transfection was detected using flow cytometry assay. **P< 0.01 compared to miR-NC, ##P< 0.01 compared to miR-486-5p.
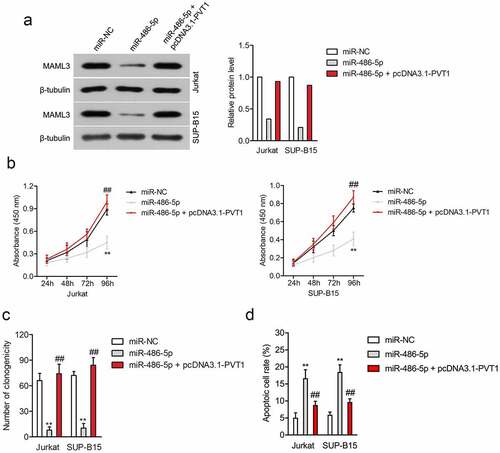
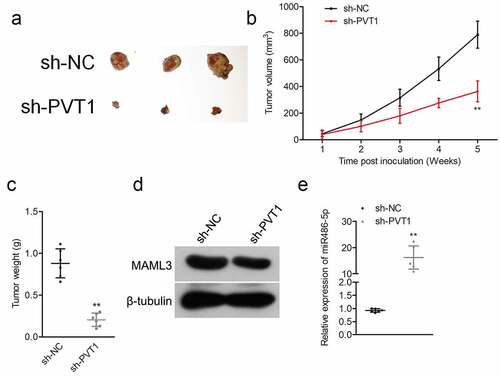
Figure 5. Sh-PVT1 decreased ALL cell xenograft tumor growth. (a) Representative xenograft tumor in each group. (b) Tumor volume was measured every week. (c) Tumor weight was detected in each group. (d) The protein level of MAML3 was detected in each group by Western blot. (e) The expression levels of miR-486-5p were examined in each group by qRT-PCR. **P< 0.01 compared to sh-NC.