Figures & data
Figure 1. PCAT6 is upregulated in gefitinib-resistance NSCLC. (a) RT-qPCR measured the PCAT6 levels in nonresistant and gefitinib-resistant NSCLC tissues. (b and c) CCK-8 evaluated the IC50 values of HCC827, HCC827/GR, PC9, and PC9/GR cells. (d) RT-qPCR detected the relative expression of PCAT6 in gefitinib-resistant NSCLC cells and the parental cells. **p < 0.01; *p < 0.05.
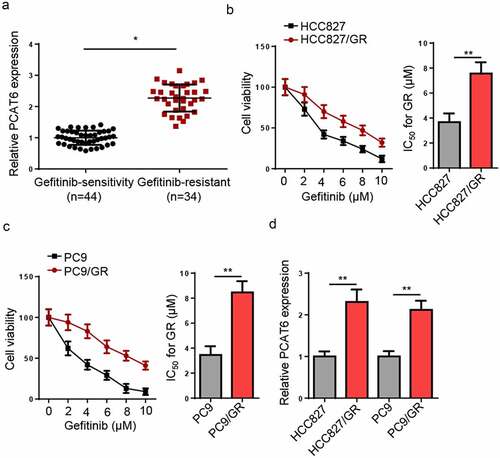
Figure 2. PCAT6 knockdown reduces gefitinib resistance of NSCLC. (a) PCAT6 levels in gefitinib-resistant HCC827 and PC9 cells in shNC and shPCAT6 groups. (b and c) Changes in IC50 value and cell viability in treated cells after silencing PCAT6. (d and e) Cell migratory and invasive abilities of cells following PCAT6 knockdown. (f) The impact of PCAT6 silence on the apoptosis of gefitinib-resistant cells. ***p < 0.001; **p < 0.01.
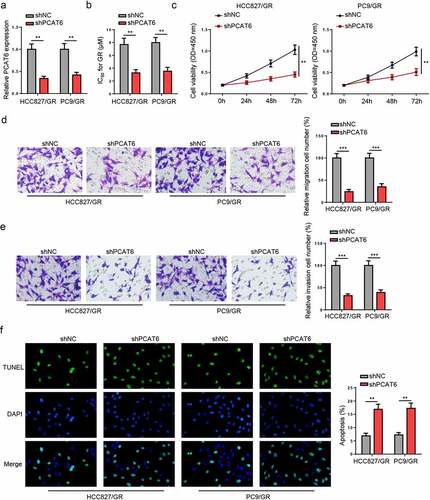
Figure 3. PCAT6 knockdown reduces gefitinib resistance of NSCLC. (a) Starbase showed the binding sites between PCAT6 and miR-326. (b) Luciferase reporter analysis for the luciferase activities of PCAT6-WT and PCAT6-MUT in gefitinib-resistant NSCLC cells. (c) RIP assay was used to detect the enrichment of PCAT6 and miR-326 in AGO2 and IgG groups. (d and e) RT-qPCR results of miR-326 expression in NSCLC tissues and cells. (f) Evaluation of miR-326 expression change by RT-qPCR following PCAT6 overexpression. ***p < 0.001; **p < 0.01; *p < 0.05.
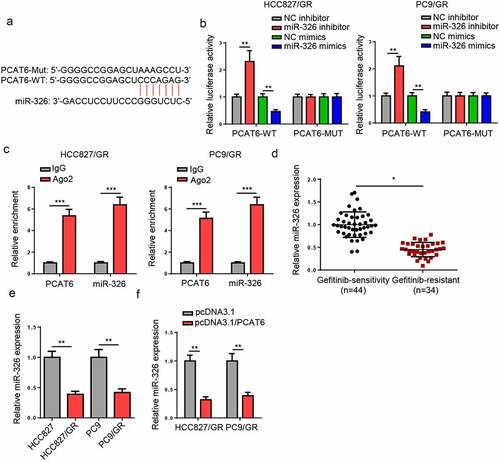
Figure 4. PCAT6 augments NSCLC resistance to gefitinib by acting as ceRNA of miR-326. (a) Relative level of miR-326 in gefitinib-resistant cells transfected with shNC, shPCAT6, and shPCAT6+ miR-326 inhibitor. (b and c) CCK-8 showed the cell viability and the IC50 of gefitinib of different groups in vitro. (d and e) The migratory and invasive abilities in gefitinib-resistant NSCLC cells were determined by Transwell assay. (f) The apoptosis of HCC827/GR and PC9/GR cells were detected by TUNEL assay. **p < 0.01; *p < 0.05.
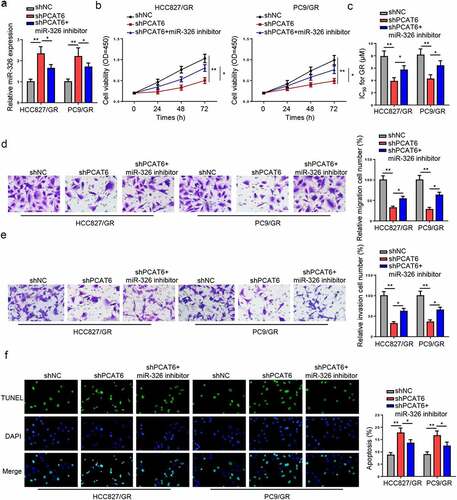
Figure 5. IFNAR2 is a downstream target of miR-326. (a) The complementary sequences between PCAT6 and miR-326. (b) Luciferase activities of IFNAR2-WT and IFNAR2-MUT in gefitinib-resistant HCC827 and PC9 cells. (c and d) RT-qPCR analysis for the IFNAR2 mRNA level in NSCLC tissues and cells. (e) Protein levels of IFNAR2 in NSCLC cells. (f and g) The levels of IFNAR2 in HCC827/GR and PC9/GR cells transfected with pcDNA3.1/PCAT6 or pcDNA3.1/PCAT6+ miR-326 mimics. **p < 0.01; *p < 0.05.
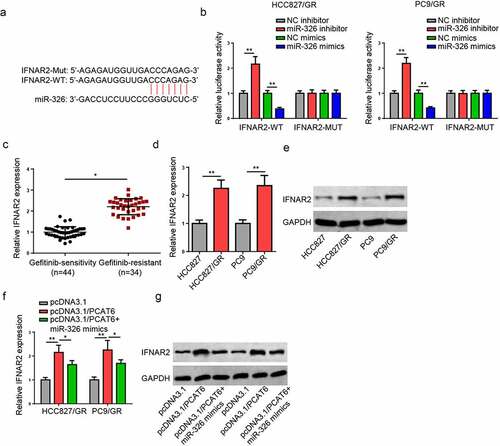
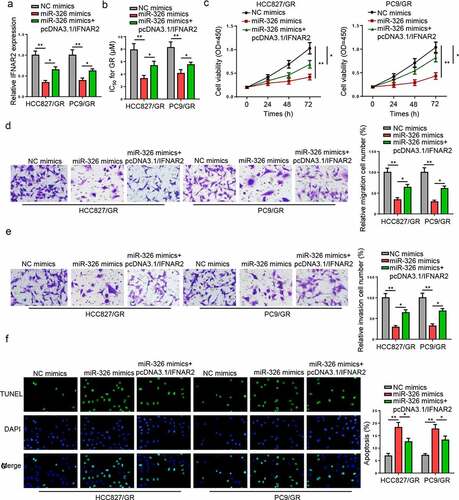
Figure 6. miR-326 reduces NSCLC cell resistance to gefitinib by inhibiting IFNAR2. (a) The relative expression of IFNAR2 was measured in gefitinib-resistant NSCLC cells transfected with NC mimics, miR-326 mimics, and miR-326 mimics+ pcDNA3.1/PCAT6. (b-f) CCK-8, transwell, and TUNEL assays indicated the cell proliferation, IC50 values, migration, invasion, and apoptosis of gefitinib-resistant NSCLC cells in different groups. **p < 0.01; *p < 0.05.