
Figures & data
Table 1. The sequences of the primers in this study
Figure 1. miR-545-3p/HS6ST2 axis might be the downstream of FAM83H-AS1 in NSCLC. (a) The overexpression of FAM83H-AS1 in LUAD samples based on GEPIA database. LUAD, lung adenocarcinoma. (b) miR-545-3p with downregulation in lung cancer was predicted to bind to FAM83H-AS1. GSE135918 was the miRNA expression profile to screen the downregulated miRNAs with adj.P < 0.05 and logFC<-2. miRDB was used to predict the miRNAs sponged by FAM83H-AS1. (c) Seven key genes were overlapped from TargetScan, starBase and GSE118370. TargetScan and starBase were used to predict the genes targeted by miR-545-3p. GSE118370 was the mRNA expression profile to screen the upregulated miRNAs with adj.P < 0.05 and logFC>2. (d) The expression of seven overlapped genes in lung adenocarcinoma samples based on the TCGA database.
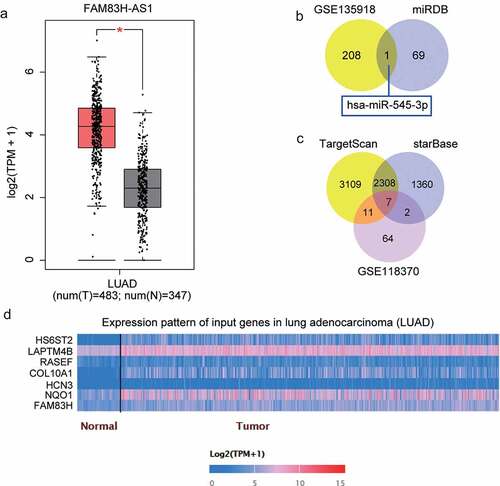
Figure 2. FAM83H-AS1 is vital for NSCLC pathogenesis. (a) The relative mRNA expression level of FAM83H-AS1 in normal lung cancer cells and NSCLC cell lines; (b) The expression levels of FAM83H-AS1 in 32 samples of normal lung tissues and NSCLC tissues. (c) Cytoplasmic and nuclear expression of FAM83H-AS1 in NSCLC cells. (d) The knockdown effect on FAM83H-AS1 relative gene expression in NSCLC cells. (e) The effect of FAM83H-AS1 knockdown on NSCLC cells’ proliferation. (f) The effect of FAM83H-AS1 knockdown on the NSCLC cells’ invasion. (g) The effect of FAM83H-AS1 knockdown on the tumor weight and volume in nude mice bearing the NSCLC HCC827 cells. Data are represented as mean ± SD. *P < 0.05, **P < 0.001, vs. si-NC.
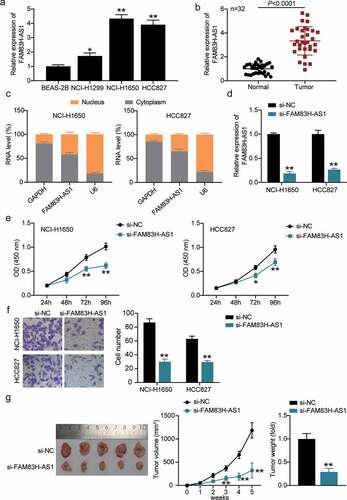
Figure 3. miR-545-3p is negatively correlated to FAM83H-AS1. (a) In silico prediction of FAM83H-AS1 target (b) Comparison of the different relative expression of FAM83H-AS1 and miR-545-3p in NSCLC cells by RNA RIP assays. (c) Luciferase activity of FAM83H-AS1-WT or FAM83H-AS1-MUTcontroling in NSCLC cells along with miR-545-3p mimic or mimic NC transfection. (d) The expression level of miR-545-3p in normal lung cells and NSCLC cells. (e) The expression level of miR-545-3p in 32 samples of normal lung tissues and NSCLC tissues. (f) A negative correlation was found between miR-545-3p and FAM83H-AS1 in NSCLC samples. Data are represented as mean ± SD. * P < 0.05,** P < 0.001.
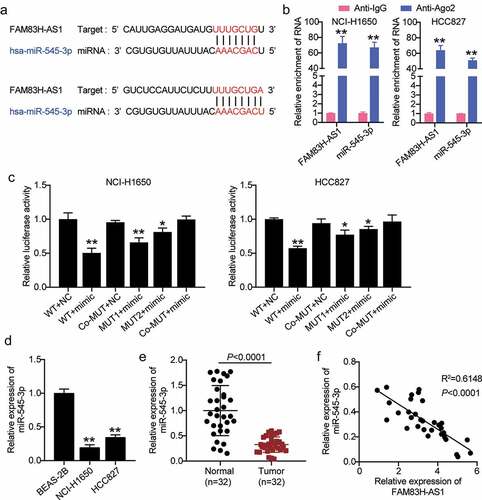
Figure 4. MiR-545-3p inhibitor reverses the suppression of FAM83H-AS1 knockdown on lung cancer cell progression. (a) The effect of FAM83H-AS1 knockdown on the miR-545-3p expression level. (b) CCK8 assay determined the effect of inhibiting the miR-545-3p and FAM83H-AS1 knockdown on the NSCLC cell proliferation. (c) The effect of inhibiting the miR-545-3p and FAM83H-AS1 knockdown on the NSCLC cell invasion. Data are represented as mean ± SD. *P < 0.05, **P < 0.001, vs.Si-NC; #P < 0.05, ##P < 0.001, vs. inhibitor-NC; ΔP<0.05, ΔΔP<0.001, vs.si-FAM83S-AS1+ inhibitor.
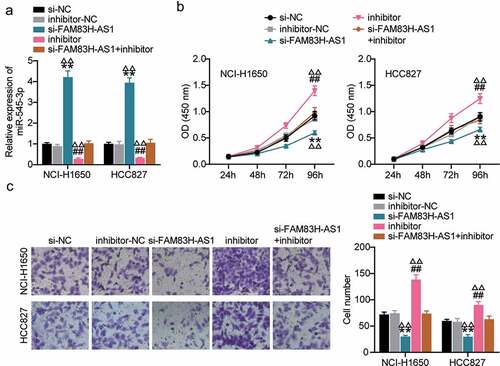
Figure 5. miR-545-3p is a target of HS6ST2. (a) Target scan prediction of the consequential pairing region of miR-545-3p. (b) Luciferase activity of HS6ST2 3ʹUTR-WT or HS6ST2-3ʹUTR-MUTcontroling in NSCLC cells along with miR-545-3p mimic or mimic NC transfection. (c) The expression level of HS6ST2 in 32 samples of normal lung tissues and NSCLC tissues. (d) The expression level of HS6ST2 in normal lung cells and NSCLC cells. (e) There was a negative correlation between the expression of HS6ST2 and miR-545-3p. Data are represented as mean ± SD. * P < 0.05, ** P < 0.001. (f) FISH assay displayed the co-location of FAM83H-AS1 and HS6ST2. (g) Western blotting detected the protein expression of HS6ST2 in NSCLC cells with the transfection of si-NC or si-FAM83H-AS1. ** P < 0.001, vs. Si-NC.
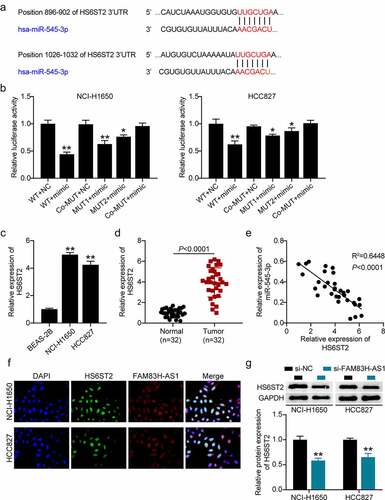
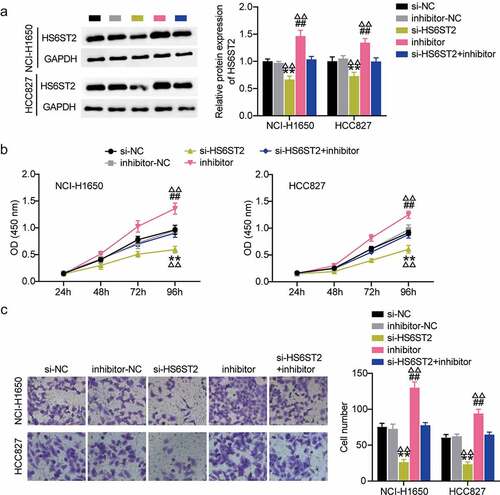
Figure 6. HS6ST2 is crucial for NSCLC cell survival. (a) Western blot analysis was utilized to determine the effect of miR-545-3p inhibition on HS6ST2 protein expression in NSCLC cells. (b) CCK8 assay was used to determine the effect of miR-545-3p inhibition and HS6ST2 knockdown on NSCLC cell proliferation. (c) The effect of inhibiting the miR-545-3p and HS6ST2 knockdown on the NSCLC cell invasion. Data are represented as mean ± SD. * P < 0.05, ** P < 0.001, vs.Si-NC; # P < 0.05, ##P < 0.001, vs. inhibitor-NC; ΔP<0.05, ΔΔP<0.001, vs.si-HS6ST2+ inhibitor.
Supplemental Material
Download Zip (30 KB)Data availability statement
The datasets used and/or analyzed during the current study are available from the corresponding author on reasonable request http://gepia.cancer-pku.cn/.