Figures & data
Table 1. Sequences of quantitative RT-PCR primers
Figure 1. Cytoplasmic circ_0000285 is robustly expressed in glioma. A. Verification of the relative expression level of upregulated circ_0000285 by RT-qPCR in glioma tissues (N = 16), **P < 0.001. B. RT-qPCR analysis of the expression of circ_0000285 in glioma cells, vs.NHA, *P < 0.05, **P < 0.001; C. Intracellular localization of circ_0000285 in SHG-44 and U251 cells. D. RNase R was used to treat circ_0000285 in SHG-44 and U251 cells to determine the circularity of the RNA, vs.Control,**P < 0.001. N = 3, repetition = 3.
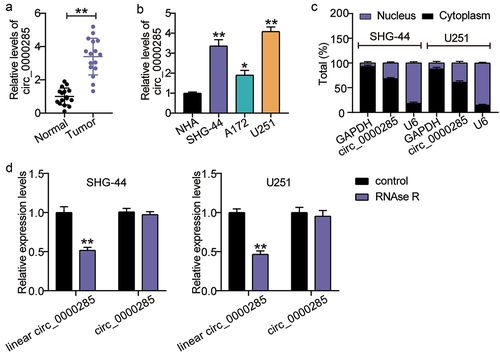
Figure 2. Circ_0000285 silence lessens tumorigenic potency both in vitro and in vivo. A. RT-qPCR analysis of circ_0000285 expression in SHG-44 and U251 cells transfected with si-circ_0000285 and si-NC, vs. si-NC, **P < 0.001. B. CCK8 assays assessing the proliferation of SHG-44 and U251 cells upon circ_0000285 silence or not, vs. si-NC, **P < 0.001. C. The quantification of the invasion assay is done by counting 3 different random fields and plotted average cell number per field. D. Western blotting analysis of Bax and Bcl-2 expression in SHG-44 and U251 cells transfected with si-circ_0000285 and si-NC, vs. si-NC, **P < 0.001. E. Subcutaneous tumor growth, xenograft tumor images and tumor weights of xenografts from SHG-44 cells with or without circ_0000285 silence in nude mice, vs. si-NC, **P < 0.001. si-circ, circ_0000285 siRNA; si-NC, si-circ negative control. N = 3, repetition = 3.
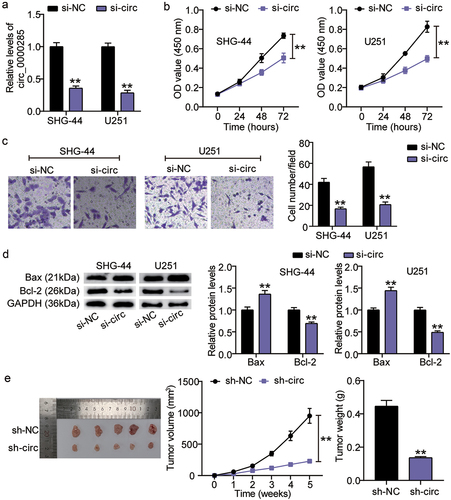
Figure 3. Circ_0000285 might regulate miR-197-3p/CKS1B axis in glioma. A. 297 upregulated genes were overlapped from GSE104291 and GEPIA. GSE104291 and GEPIA including the mRNA expression profile in glioma samples were used to screen the upregulated genes with adj.P < 0.05 and logFC>2. B. Pathways in cancer was enriched by Metascape. Metascape was used to enrich the key biological processes for 297 upregulated genes. C. The expression pattern of 20 genes in glioblastoma multiforma according to the data from TCGA. D. The expression of CKS1B, CKS2 and GNG12 in glioma tissues (N = 16) and adjacent normal tissues (N = 16) was detected by qRT-PCR. (E) miR-197-3p was only miRNA that could bind to circ_0000285 and CKS1B based on starBase prediction. Repetition = 3.
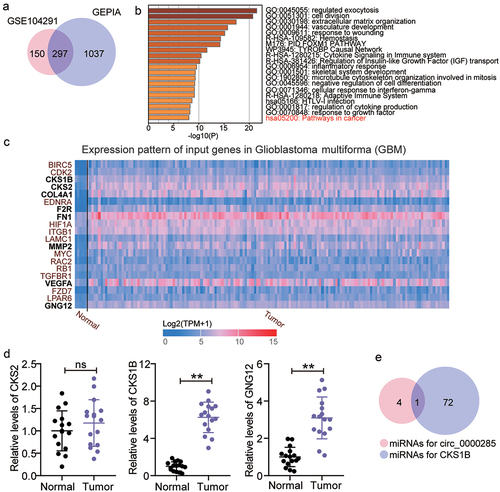
Figure 4. Circ_0000285 targets miR-197-3p. A. miR-197-3p binding sites prediction of circ_0000285 in Starbase. B. Luciferase reporter experiments were performed with Firefly-luciferase-circ_0000285, control Renilla-luciferase and miR-197-3p mimic or mimic NC, vs.miR-NC,**P < 0.001. C. AGO2-dependent RNA immunoprecipitation (RIP) assay in SHG-44 and U251 cells, vs.Anti-lgG,**P < 0.001. D. Verification of the relative expression level of downregulated miR-197-3p by RT-qPCR in glioma tissues. E. RT-qPCR analysis of the expression of miR-197-3p in glioma cells, vs.NHA,**P < 0.001. F. The Pearson correlation between miR-197-3p mRNA expression and circ_0000285 expression in glioma tissues. N = 3, repetition = 3.
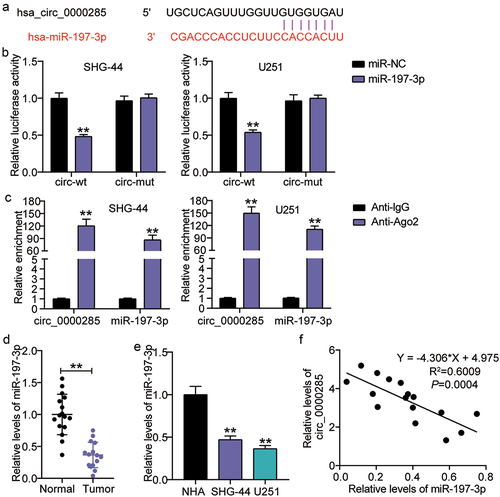
Figure 5. Cell malignant phenotypes suppressed by circ_0000285 silence is restored upon miR-197-3p inhibitor. SHG-44 and U251 cells were transfected with si-circ_0000285, si-NC, miR-197-3p inhibitor, inhibitor NC, si-circ_0000285+ miR-197-3p inhibitor. 48 h posttransfection. A. RT-qPCR analysis of miR-197-3p expression. B. Cell viability was measured with CCK8. C. Cell invasion was detected by Transwell invasion assay. D. Western blotting analysis of Bax and Bcl-2 expression. Vs.si-NC,**P < 0.001; vs.inhibitor-NC, ++P < 0.001; vs,si-circ+inhibitor, ##P < 0.001. si-circ, circ_0000285 siRNA; si-NC, si-circ negative control; inhibitor, miR-197-3p inhibitor; inhibitor-NC, inhibitor negative control. N = 3, repetition = 3.
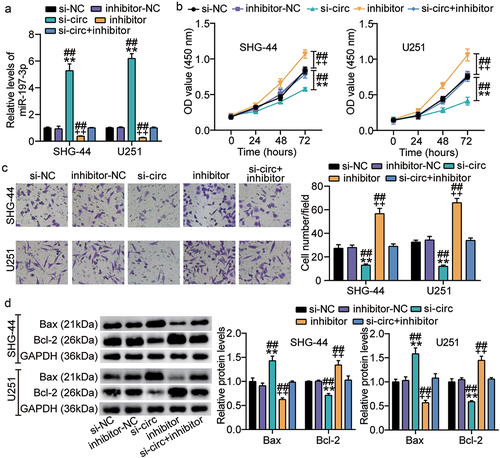
Figure 6. miR-197-3p targets CKS1B. A. Binding sequence of miR-197-3p in CKS1B 3′UTR predicted by starBase. B. SHG-44 and U251 cells were transfected with CKS1B-3ʹUTR-WT or CKS1B-3ʹUTR-MUT luciferase vectors. After 48 h, the luciferase activity was monitored, vs.miR-NC,**P < 0.001 C. RT-qPCR analysis of CKS1B expression in MHA, SHG-44 and U251 cells, vs.NHA,**P < 0.001. D. Pearson Correlation analysis was used in miR-197-3p and CKS1B expression in glioma tissues. N = 3, repetition = 3.
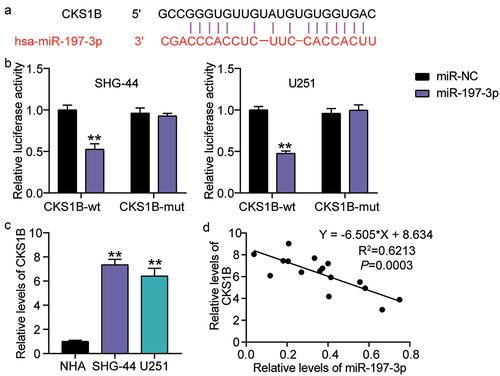
Figure 7. Silencing CKS1B also compromises the malignant behaviors of glioma cells induced by miR-197-3p inhibitor. SHG-44 and U251 cells were cotransfected with si-CKS1B, si-NC, miR-197-3p inhibitor, inhibitor NC, si-CKS1B+ inhibitor. A. Western blotting analysis of CKS1B expression. B. Cell viability was measured with CCK8. C. Cell invasion was detected by Transwell invasion assay. D. Western blotting analysis of Bax and Bcl-2 expression, vs. si-NC, **P < 0.001; vs. inhibitor-NC, ++P < 0.001; vs. si-CKS1B+inhibitor, #P < 0.05, ##P < 0.001. si-CKS1B, CKS1B siRNA; si-NC, si-CKS1B negative control; inhibitor, miR-197-3p inhibitor; inhibitor-NC, inhibitor negative control. N = 3, repetition = 3.
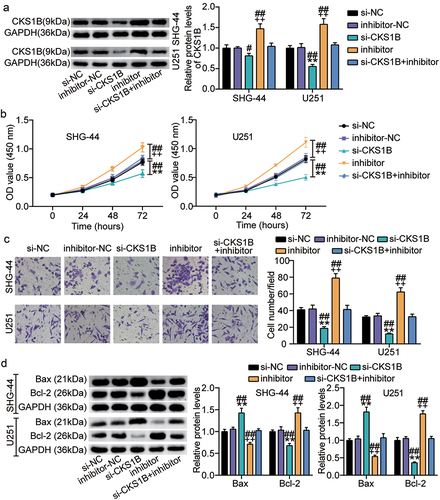
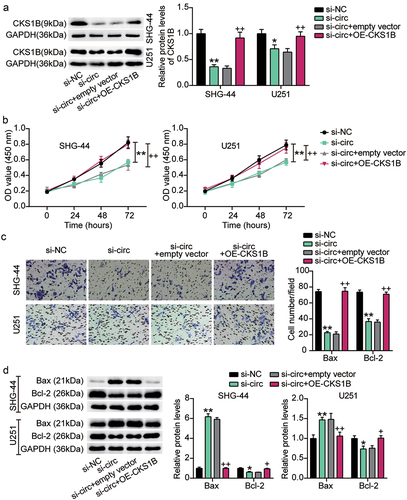
Figure 8. CKS1B overexpression reversed the malignant behavior of glioma cells inhibited by circ_0000285 knockdown. SHG-44 and U251 cells were cotransfected with si-circ, si-NC, si-circ+empty vector, si-circ+OE-CKS1B. A. Western blotting analysis of CKS1B expression. B. Cell viability was measured with CCK8. C. Cell invasion was detected by Transwell invasion assay. D. Western blotting analysis of Bax and Bcl-2 expression, vs. si-NC, *P < 0.05, **P < 0.001; vs. si-circ+empty vector, #P < 0.05, ##P < 0.001. si-circ, circ_0000285 siRNA; si-NC, si-circ negative control; OE-CKS1B, CKS1B overexoression. N = 3, repetition = 3.