
Figures & data
Figure 1. Serum levels of circCHFR and miR-15b-5p in atherosclerosis patients.
The expression of (A) circCHFR and (B) miR-15b-5b in the serum samples from 30 patients with atherosclerosis and 30 age-matched healthy subjects was detected by qRT-PCR (n = 30). All experiments were repeated three times. **p < 0.01.
Figure 2. Relationship between circCHFR and miR-15b-5p.
(A) Bioinformatic tool StarBase depicting the relationship between circCHFR and miR-15b-5p; Verification of binding site by (B) Dual fluorescence assay and (C) RNA pull down technique. All experiments were repeated three times. **p < 0.01 vs. mimic control; ##p < 0.01 vs. Oligo probe.
Figure 3. Expression profile of circCHFR and miR-15b-5p in ox-LDL-induced HUVECs.
Expression of circCHFR (A) and miR-15b-5p (B) was detected by qRT-PCR in HUVECs treated with varying levels of ox-LDL (0, 50, 100, and 150 μg/mL) for 24 h. All experiments were repeated three times. *, **p < 0.05, 0.01 vs. Control.
Figure 4. CircCHFR negatively regulates miR-15b-5p expression in HUVECs.
(A) Gene expression of circCHFR-siRNA in HUVECs transfected with control-siRNA and circCHFR-siRNA was detected using RT-qPCR; (B) Gene expression of miR-15b-5p in HUVECs transfected with inhibitor control and miR-15b-5p inhibitor was detected using RT-qPCR; (C) Gene expression of miR-15b-5p in HUVECs transfected with control-siRNA, circCHFR-siRNA, circCHFR-siRNA+inhibitor control and circCHFR-siRNA+miR-15b-5p inhibitor was detected using RT-qPCR. All experiments were repeated three times. **p < 0.01 vs. Control-siRNA; ##p < 0.01 vs. inhibitor control; &&p < 0.01 vs. circCHFR-siRNA+inhibitor control.
Figure 5. Protective role of circCHFR-siRNA in ox-LDL-exposed HUVECs.
(A) The viability of HUVECs in the ox-LDL group was significantly decreased; (B–C). Apoptosis was significantly enhanced in the ox-LDL group; (D–F) Bax and Bcl-2 expression determined by Western blotting and qRT-PCR; (G–I) The secretion of cytokines in cell supernatants determined by ELISA kits. All experiments were repeated three times. **p < 0.01 vs. Control; ##p < 0.01 vs. ox-LDL+control-siRNA; &&p < 0.01 vs. ox-LDL+circCHFR-siRNA+inhibitor control.
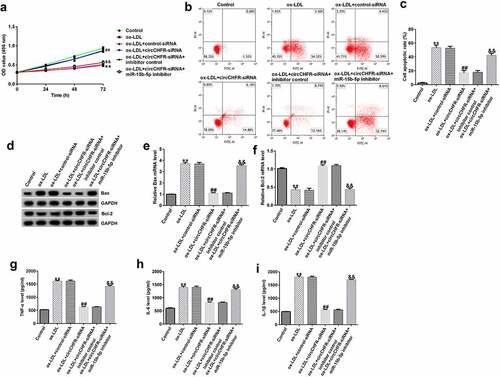
Figure 6. miR-15b-5p directly targets GADD45G.
(A) TargetScan predicting the miR-15b-5p and GADD45G interaction; (B) Dual luciferase assay verifying the binding location. All experiments were repeated three times. **p < 0.01 vs. mimic control
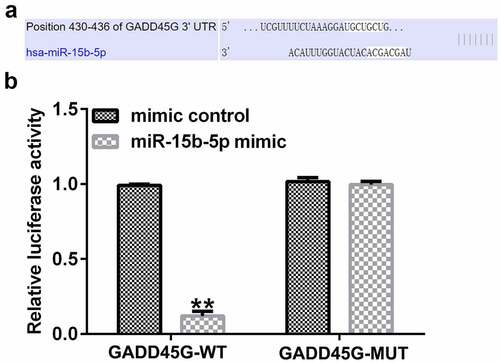
Figure 7. miR-15b-5p negatively regulates GADD45G expression in HUVECs.
(A) Mimic control, and miR-15b-5p mimic were transfected into HUVECs, and then the level of miR-15b-5p was measured using RT-qPCR; (B) Control plasmid and GADD45G-plasmid were transfected into HUVECs, and then the mRNA level of GADD45G was measured using RT-qPCR; (C and D) miR-15b-5p mimic+control plasmid and miR-15b-5p mimic+GADD45 G plasmid were transfected into HUVECs, and then the mRNA and protein levels of GADD45 G were measured using RT-qPCR and Western blot assay. All experiments were repeated three times. **p < 0.01 vs. mimic control; ##p < 0.01 vs. Control-plasmid; &&p < 0.01 vs. miR-15b-5p mimic+control-plasmid.
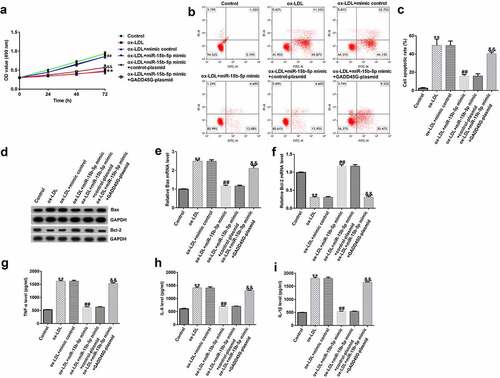
Figure 8. Protective role of miR-15b-5p in ox-LDL-treated HUVECs.
(A) The cell viability of ox-LDL group; (B–C) Cell apoptosis detected by flow cytometry; (D–F) The levels of Bax and Bcl-2 determined by Western blotting and qRT-PCR; (G–I) Cytokine expression determined by ELISA kits. All experiments were repeated three times. **p < 0.01 vs. Control; ##p < 0.01 vs. ox-LDL+mimic control; &&p < 0.01 vs. ox-LDL+miR-15b-5p mimic+control-plasmid.
Supplemental material
Supplemental Material
Download TIFF Image (400.5 KB)Data availability statement
The datasets used and/or analyzed during the current study are available from the corresponding author on reasonable request.