
Figures & data
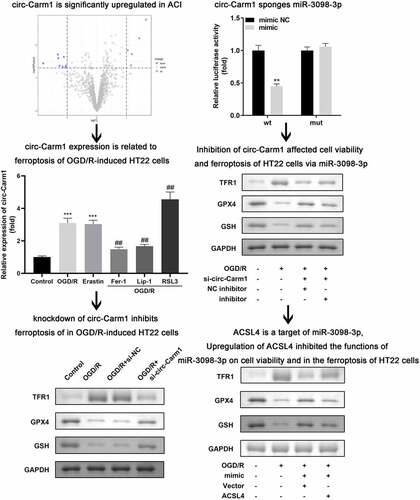
Table 1. General characteristics of the ACI patients
Figure 1. Circ-Carm1 is highly expressed in the ACI. (a) Volcano map of dysregulated circRNAs identified in ACI. (b) circ-Carm1 expression in the serum of patients with ACI and healthy volunteers was measured by RT-qPCR. (c) circ-Carm1 expression in HT22 cells treated with OGD/R performance, 4.6 μM Erastin, 5 μM ferrostatin-1 (Fer-1), 22 μM liproxstatin-1 (Lip-1), and 0.5 µM RSL3 separately was detected by RT-qPCR.
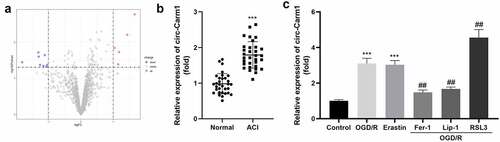
Figure 2. Depletion of circ-Carm1 restores cell viability and inhibits ferroptosis of HT22 cells. (a) circ-Carm1 expression levels were determined by RT-qPCR after circ-Carm1 knockdown. (b) Cell viability of HT22 cells was detected using the CCK-8 assay before and after circ-Carm1 knockdown. (c-d) TUNEL staining was used to detect cell death before and after circ-Carm1 knockdown. (e-f) Levels of Fe2+ and malondialdehyde (MDA) were determined using an enzyme-linked immunosorbent assay. (g-j) Protein levels of transferrin receptor 1 (TFR1), glutathione peroxidase 4 (GPX4), and glutathione (GSH) were detected by Western blotting.
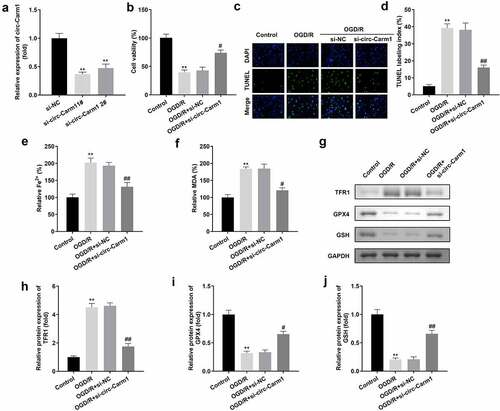
Figure 3. Carm1 sponges miR-3098-3p. (a) The binding sites between miR-3098-3p and circ-Carm1 were predicted by bioinformatics analysis. (b) Relative luciferase activity of HT22 cells co-transfected with wt circ-Cram1 and miR-3098-3p mimics. (c) RT-qPCR analysis of circ-Carm1 expression enriched in biotin containing miR-3098-3p. (d) The FISH assay was used to detect the location of circ-Carm1 and miR-3098-3p. (e) miR-3098-3p expression in the serum of patients with ACI and healthy volunteers was measured by RT-qPCR. (f) RT-qPCR analysis of miR-3098-3p expression in OGD/R-induced HT22 cells. (g) RT-qPCR analyses of miR-3098-3p expression in HT22 cells transfected with si-circ-Carm1.
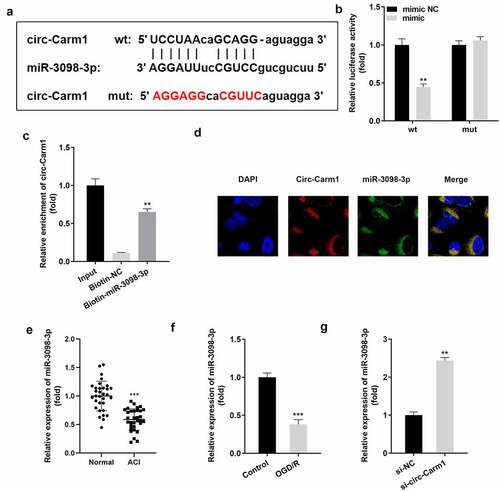
Figure 4. Downregulation of miR-3098-3p reverses the effects of circ-Carm1 deficiency on cell viability and ferroptosis of HT22 cells. (a) miR-3098-3p expression levels were detected using RT-qPCR after transfection. (b) Cell viability of HT22 cells co-transfected with si-circ-Carm1 and miR-3098-3p inhibitor and was detected using the CCK-8 assay. (c-d) TUNEL staining was conducted to detect cell death in cells co-transfected with si-circ-Carm1 and miR-3098-3p inhibitor. (e-f) Levels of Fe2+ and malondialdehyde (MDA) were determined using an enzyme-linked immunosorbent assay. (g-j) Protein levels of transferrin receptor 1 (TFR1), glutathione peroxidase 4 (GPX4), and glutathione (GSH) were detected by Western blotting.
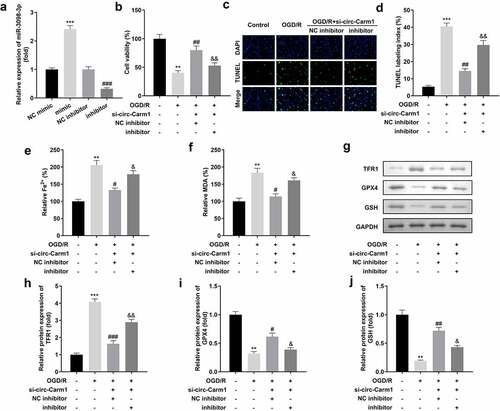
Figure 5. ACSL4 is a target gene of miR-3098-3p. (a) Binding sites between miR-3098-3p and ACSL4 were predicted by bioinformatics analysis. (b) Relative luciferase activity of HT22 cells co-transfected with wt ACSL4 and the miR-3098-3p mimic. (c) RT-qPCR analyses of ACSL4 expression enriched in biotin containing miR-3098-3p. (d) RT-qPCR analysis of ACSL4 expression in OGD/R-induced HT22 cells. (e) ACSL4 protein and mRNA expression in HT22 cells transfected with the miR-3098-3p mimic.
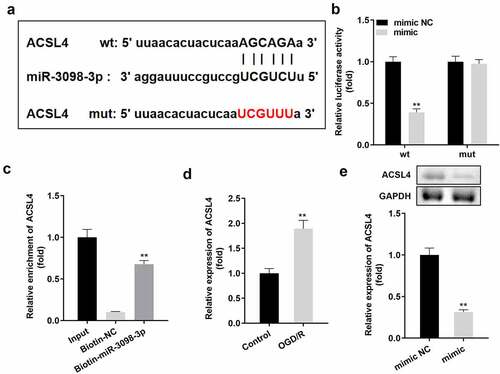
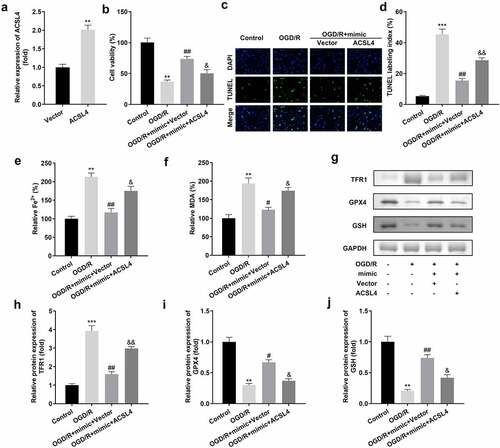
Figure 6. Overexpression of ACSL4 inhibits the functions of miR-3098-3p. (a) miR-3098-3p expression levels were detected using RT-qPCR after transfection. (b) Cell viability of HT22 cells co-transfected with miR-3098-3p mimic and overexpressing ACSL4 plasmids were detected using the CCK-8 assay. (c-d) TUNEL staining was used to detect cell death in cells co-transfected with the miR-3098-3p mimic and overexpressed ACSL4 plasmids. (e-f) Levels of Fe2+ and malondialdehyde (MDA) were determined using an enzyme-linked immunosorbent assay. (g-j) Protein levels of transferrin receptor 1 (TFR1), glutathione peroxidase 4 (GPX4), and glutathione (GSH) were detected by Western blotting.
Supplemental Material
Download Zip (1.4 MB)Data Availability Statement
The datasets used and analyzed during the current study are available from the corresponding author on reasonable request.