Figures & data
Figure 1. Inhibition of circ-ZNF609 inhibited the proliferation of thyroid cancer cells. (a) Relative expression of circ-ZNF609 in several TC cell lines and normal thyroid cell line Nthy-ori 3–1, examined with the application of qRT-PCR. (b) Relative expression of circ-ZNF609 in TPC-1 and IHH-4 cells following circ-ZNF609 knockdown. Cell proliferation of TPC-1 and IHH-4 transfected with sh-circ-ZNF609, assayed with the use of CCK-8 assay (c) and colony formation assay (d-e). (f) Ki-67 expression in TPC-1 and IHH-4 transfected with sh-circ-ZNF609, examined applying immunofluorescence staining. Original magnification: 200 × . (g) Levels of Ki-67 and PCNA in TPC-1 and IHH-4 transfected with sh-circ-ZNF609, tested utilizing Western blotting. All experimental results are recorded in the form of mean ± SD. *P < 0.05, **P < 0.01, ***P < 0.001 versus control or sh-NC.
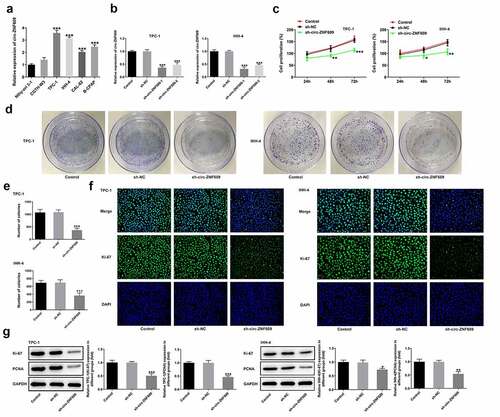
Figure 2. Circ-ZNF609 silencing suppressed the migration and invasion in TPC-1 and IHH-4 cells. (a) Cell migration detection employed wound healing following circZNF609 knockdown. Original magnification: 100 × . (b) Cell invasion was tested via transwell assay following circZNF609 knockdown. Original magnification: 100 × . (c) Levels of MMP2 and MMP9 following circZNF609 knockdown, examined with the aid of Western blotting. All experimental results are recorded in the form of mean ± SD. **P < 0.01, ***P < 0.001 versus sh-NC.
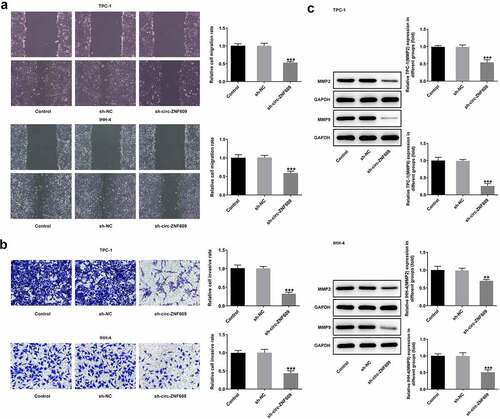
Figure 3. Circ-ZNF609 silencing inhibited tumor growth in vivo. (a-d) The tumor weight and volume of mice injected with sh-circ-ZNF609 were observed and measured. (e) Relative expression of circ-ZNF609 in tumor tissues, assayed through the way of qRT-PCR. (f) Immunohistochemistry experiments about Ki-67 in tumor tissue from the sh-circZNF609 mice. Original magnification: 200 × . (g-h) Levels of Ki-67 and PCNA in mice injected with TPC-1 and IHH-4 cells transfected with sh-circ-ZNF609, assessed with the adoption of Western blotting. All experimental results are recorded in the form of mean ± SD. *P < 0.05, **P < 0.01, ***P < 0.001 versus sh-NC.
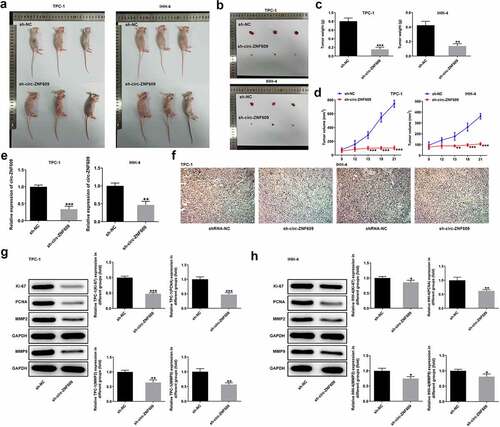
Figure 4. miR-514a-5p was sponged by circ-ZNF-609. (a) The binding site of circ-ZNF609 and miR-514a-5p. (b) Relative expression of miR-514a-5p in several TC cell lines and normal thyroid cell line Nthy-ori 3–1, examined with the employment of qRT-PCR. (c) Relative expression of miR-514a-5p in TPC-1 and IHH-4 cells transfected utilizing miR-514a-5p mimic. (d) Relative luciferase reporter activity was measured in cells co-transfected with miR-514a-5p mimics and wild type or mutant circ-ZNF-609. (e) Relative expression of miR-514a-5p in TC cells transfected with sh-circ-ZNF609, tested through the way of qRT-PCR. All experimental results are recorded in the form of mean ± SD. *P < 0.05, **P < 0.01, ***P < 0.001 versus control or sh-NC.
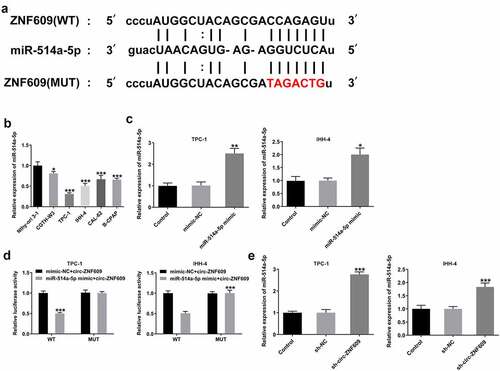
Figure 5. Circ-ZNF609 promotes cell growth and metastasis by down-regulating miR-514a-5p in TPC-1 and IHH-4 cells. (a) Cell proliferation assay employed the experiment of CCK-8. (b) Levels of Ki-67 and PCNA were assessed with the application of Western blot. (c) Cell migration evaluation was undertaken with the help of wound healing. Original magnification: 100 × . (d) Cell invasion experiment was carried out via the way of transwell. Original magnification: 100 × . (e) Levels of MMP2 and MMP9 was examined applying Western blotting. All experimental results are recorded in the form of mean ± SD. *P < 0.05, **P < 0.01, ***P < 0.001 versus sh-NC + inhibitor-NC. #P < 0.05, ##P < 0.01, ###P < 0.001 versus sh-circ-ZNF609 + inhibitor-NC.
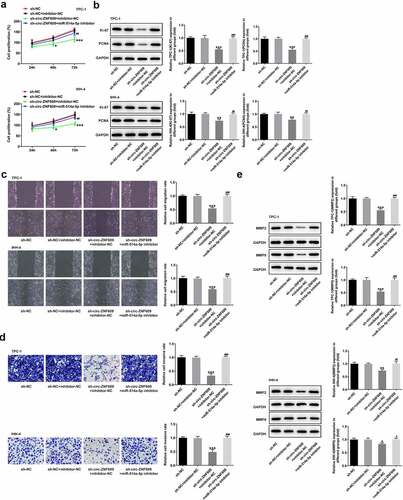
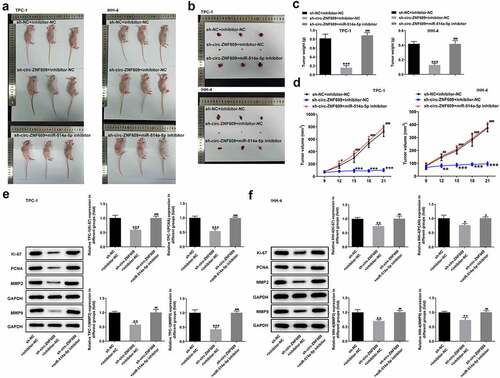
Figure 6. Circ-ZNF609 facilitated tumor growth by down-regulating miR-514a-5p in vivo. (a-d) The tumor weight and volume of mice treated with sh-circ-ZNF609 in the presence or absence of miR-514a-5p inhibitor were observed and measured. (e-f) Levels of Ki-67 and PCNA in TPC-1 and IHH-4 cells transfected with sh-circ-ZNF609 in the presence or absence of miR-514a-5p inhibitor, assayed employing Western blotting. All experimental results are recorded in the form of mean ± SD. *P < 0.05, **P < 0.01, ***P < 0.001 versus sh-NC + inhibitor-NC. #P < 0.05, ##P < 0.01, ###P < 0.001 versus sh-circ-ZNF609 + inhibitor-NC.