Figures & data
Table 1. Comparison of mouse lung coefficients in each group (mean ± SD, n = 6)
Figure 1. Morphological changes after HE staining (a) (200X, Scale bar = 50 μm) and injury scores (b) in mouse lung tissue in different groups (mean ± SD, n = 3), ***P < 0.001 vs sham group; ##P < 0.01 vs CLP group.
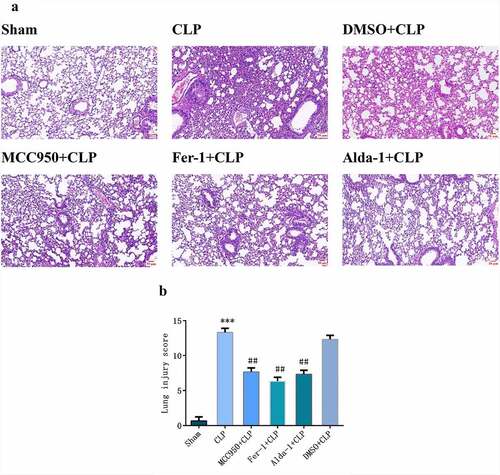
Figure 2. The transmission electron microscopy images of mouse lung tissue (10000x, Scale bar = 2 μm), nucleus (Nu), lamellar bodies (LBs), and mitochondria (Mt).
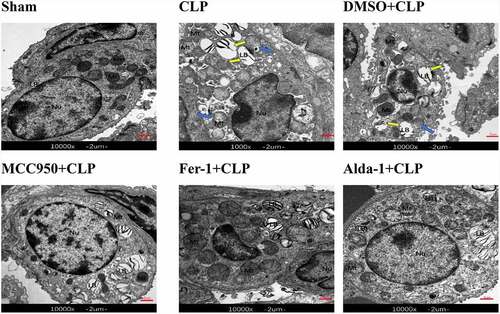
Figure 3. Detection of MDA (a) and iron (b) in lung tissue of mice (mean ± SD, n = 5), ***P < 0.001 vs sham group; #P < 0.05, ##P < 0.01 vs CLP group.
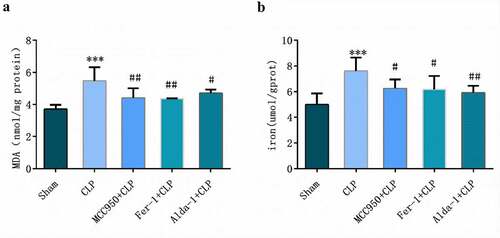
Figure 4. DHE detection of ROS expression and fluorescence statistics in mouse lung tissue in different groups (200X, Scale bar = 50 μm) a: sham group; b: CLP group; c: MCC950+ CLP group; d: Fer-1+ CLP group; e: Alda-1+ CLP group; f: Fluorescent statistical results (mean ± SD, n = 5), ***P < 0.001 vs sham group; ##P < 0.01 vs CLP group.
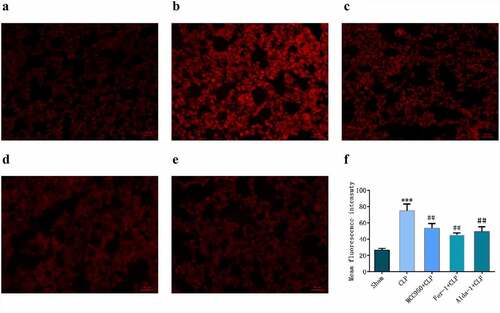
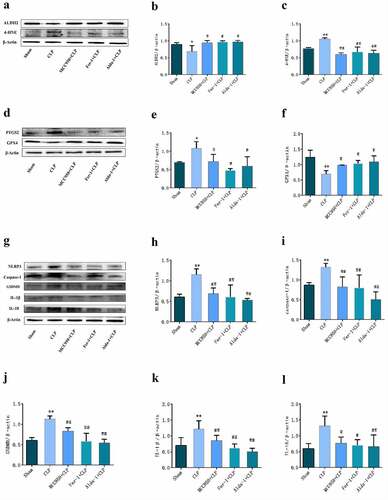
Figure 5. The typical Western blot pictures and statistical results of each group. a, d, g: typical Western blot bands of lung tissue; b, c, e, f, h, i, j, k, l: changes in the expression of different proteins in the lung tissues of each group. (mean ± SD, n = 3), *P < 0.05, **P < 0.01 vs sham group; #P < 0.05, ##P < 0.01 vs CLP group.