Figures & data

Figure 1. The role of HCG18 in GC. (a) HCG18 mRNA levels in GC tumor and normal tissues (n = 21) were detected by qRT-PCR. (b) HCG18 mRNA levels in BSG823, HS-746 T, MKN-28, and 9811 cell lines were detected by qRT-PCR. (c) Under different treatment conditions, HCG18 mRNA levels in MKN-28 cells were detected by qRT-PCR. (d) MKN-28 cell proliferation was detected by CCK-8 assay. (e and f) MKN-28 cell proliferation was detected by colony formation assay. (g-j) MKN-28 cell invasion and migration were detected by transwell assay. n = 3, * p < 0.05.
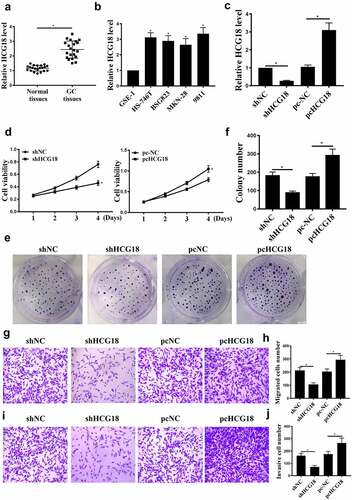
Figure 2. HCG18 regulated miR146a-5p expression in GC cells. (a) miR146a-5p mRNA levels in BSG823, HS-746 T, MKN-28, and 9811 cell lines were detected by qRT-PCR. (b-c) MiR-146a-5p levels in MKN-28 cells under different treatment conditions were evaluated by qRT-PCR. (d) HCG18 mRNA level in cells with miR-146a-5p overexpression was detected by qRT-PCR. (e) The putative target sequence between HCG18 and miR146a-5p was predicted using StarBase V3.0 (http://starbase.sysu.edu.cn/). f. Luciferase reporter assay was performed in MKN-28 cells. g. Correlation between miR-146a-5p and HCG18 in GC tissues was evaluated by Pearson’s correlation analysis. n = 3, * p < 0.05.
Figure 3. The effects of HCG18 on GC cells were mediated by miR-146a-5p. (a) MKN-28 cell viability was detected by CCK-8 assay. (b-d) MKN-28 cell invasion and migration were evaluated using Transwell assays. (e and f) MKN-28 cell proliferation was detected by colony formation. n = 3, * p < 0.05.
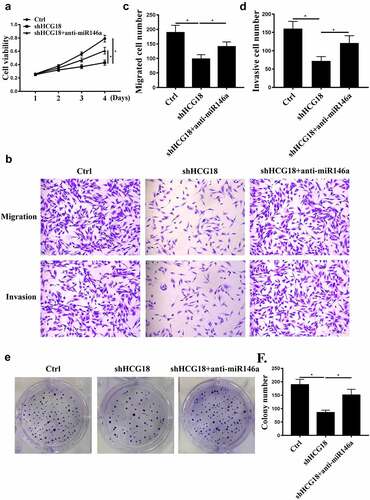
Figure 4. TRAF6 was a direct target of miR-146a-5p. (a) Target sequence of miR-146a-5p on the 3’-UTR of TRAF6 was predicted using StarBase V3.0 (http://starbase.sysu.edu.cn). (b) Luciferase activity was measured in MKN-28 cells. (C) TRAF6 protein level in MKN-28 cells after miR-14a-5p mimic transfection was measured by Western blot. (d) TRAF6 and p65 protein levels in MKN-28 cells were detected using Western blot. * P < 0.05, n = 3.
Figure 5. The effects of TRAF6 on GC. (a) TRAF6 mRNA levels after si-TRAF6 transfection were detected by qRT-PCR. (b) MKN-28 cell viability was detected by CCK-8 assay. (c) MKN-28 cell proliferation was detected by colony formation assay. (d), (e) MKN-28 cell invasion and migration were detected by Transwell assay. n = 3, * p < 0.05.
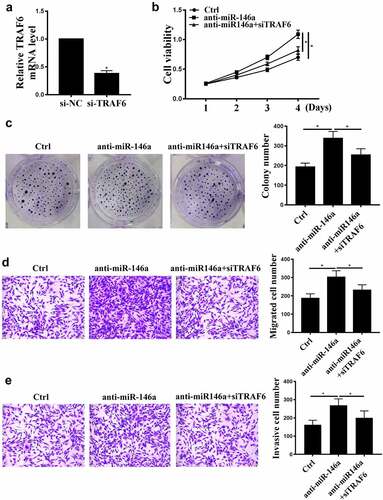
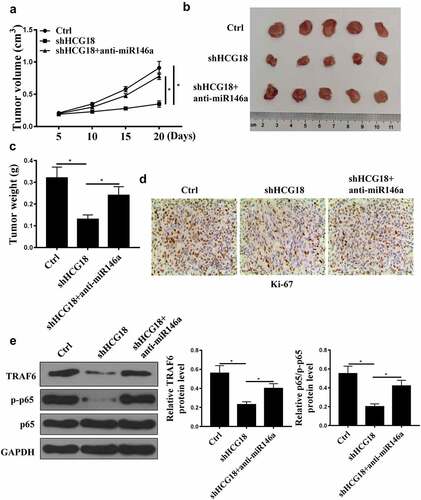
Figure 6. HCG18 promoted tumor growth in vivo. (a) GC tumor volume in different groups was detected. (B) Tumor tissues in different groups were photographed. (c) GC tumor weight in different groups was measured. (d) Immunochemistry of tumor tissues in different groups was detected using Ki67 assay. (E) TRAF6 and p65 protein levels were detected by Western blot. * p < 0.05.