Figures & data
Table 1. Basic characteristics of recruited patients
Figure 1. Differential expression of circRNA_FOXO3, miR-23a and FOXO3 mRNA in the peripheral blood of patients with ICU-acquired sepsis (one-way ANOVA and Tukey’s test, * P value < 0.05 vs. Group 1).
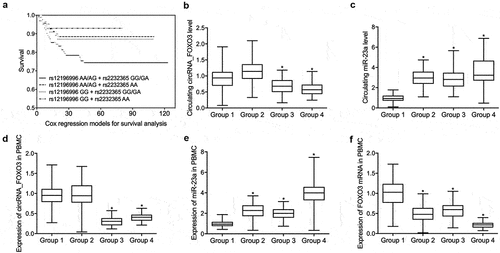
Figure 2. Differential expression of IL-10, TNF, IL-2 and IFN in the peripheral blood of patients with ICU-acquired sepsis (one-way ANOVA and Tukey’s test, * P value < 0.05 vs. Group 1).
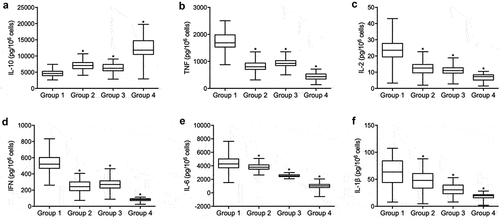
Figure 3. miR-23a suppressed the expression of circRNA_FOXO3 and FOXO3 (* P value < 0.05 vs. control group).
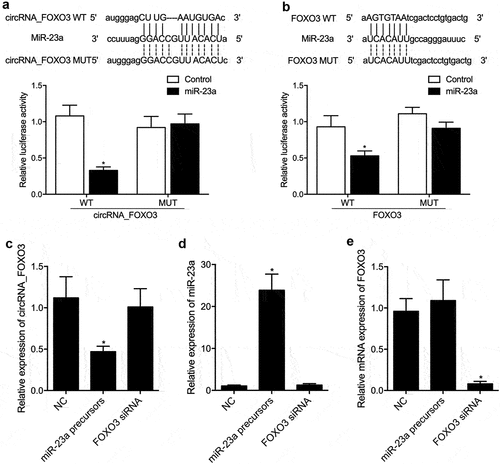
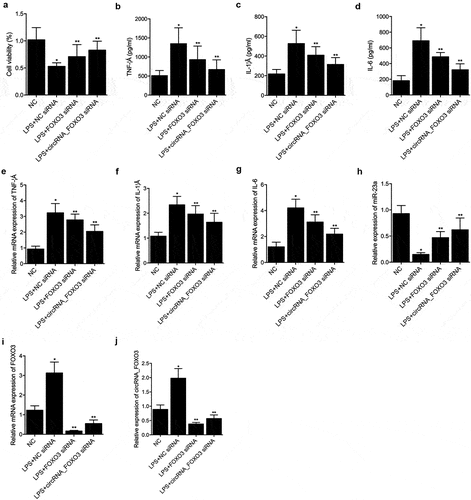
Figure 4. CircRNA_FOXO3 siRNA and FOXO3 siRNA restored the LPS induced dys-regulation of TNF-α, IL-1β, IL-6, miR-23a, circRNA_FOXO3 and FOXO3 (one-way ANOVA and Tukey’s test, * P value < 0.05 vs. NC group; ** P value < 0.05 vs. LPS+NC siRNA).