
Figures & data
Figure 1. CircZNF609 was up-regulated in LSCC and predicts a poor prognosis for LSCC. (a) circZNF609 expression in LSCC tissues (n = 42). (b) circZNF609 expression in LSCC cell lines and human bronchial epithelial cells. (c) For analysis of LSCC patients’ survival, Kaplan-Meier analysis was used. ** P < 0.01, *** P < 0.001.
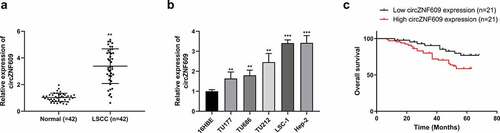
Table 1. Correlations between circZNF609 and clinical characteristics of 42 laryngeal cancer patients
Figure 2. CircZNF609 promoted the malignant behavior of LSCC cells. (a) qRT-PCR was used to detect circZNF609#1, circZNF609#2, and circZNF609#3 transfection efficiency in LSCC cells. (b) cell viability analysis. (c) cell proliferation analysis (d) cell colony formation analysis. (e) cell invasion analysis (f) PCNA and MMP-2 protein expression.* p < 0.05, ** p < 0.01.
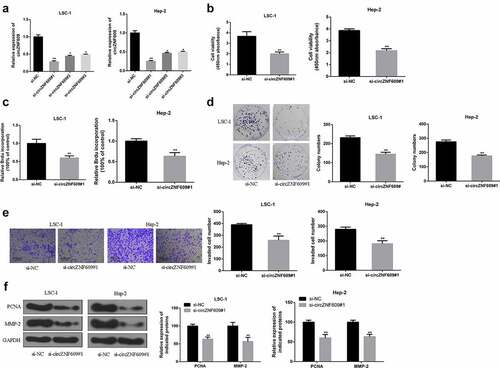
Figure 3. miR-134-5p is a circZNF609 target. (a) The binding site between circZNF609 and miR-134-5p (b) LSC-1 and Hep-2 cell luciferase activity analysis. (c) miR-134-5p expression in LSC-1 and Hep-2 cells. (d) miR-134-5p expression in adjacent normal and LSCC tissues (n = 42). (e) The correlation analysis in LSCC tissues (n = 42) (r = −0.662, P < 0.001). ** P < 0.01, *** P < 0.001.
Figure 4. circZNF609 upregulated EGFR by sponging miR-134-5p. (a) Binding sites for EGFR 3’-UTR and miR-134-5p. (b) Luciferase activity analysis. (c) EGFR mRNA expression. (d) EGFR protein expression. (e) The correlation analysis in LSCC tissues (n = 40). #vs miR-134-5p simulation group, * vs control group, ** vs control, P < 0.01, vs miR-NC + circZNF609, #P < 0.05.
Figure 5. (a) Cell viability analysis. (b) Cell proliferation analysis. (c) Cell colony formation analysis. (d) Cell invasion analysis. #vs circZNF609 group, * vs control vector group, **P < 0.01, #P < 0.05 compared with circZNF609.
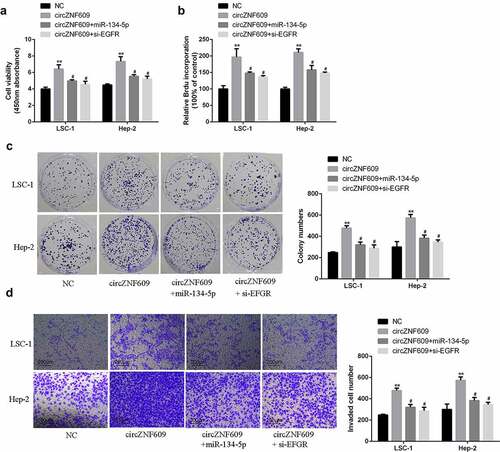
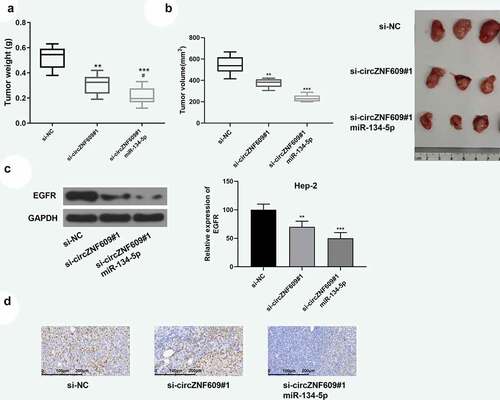
Figure 6. circZNF609 modulated the miR-134-5p/EGFR axis to promote LSCC progression in vivo. Hep-2 cells (1 × 10⁷ cells per 0.1 mL) stably transfected with si- circZNF609#1 or si-circZNF609#1+ miR-134-5p, si-NC (n = 6). Hep-2 cells were implanted subcutaneously into nude mice, and tumor weight (a) and volume (b) was evaluated. (c) EGFR protein expression. (d) IHC staining was used to detect ki-67 expression (×100, scale = 100 μm). vs si-circZNF609, #P < 0.05, *** P < 0.001, ** P < 0.01, vs p-NC.
Supplemental Material
Download TIFF Image (10.9 MB)Data availability statement
The data that support the findings of this study are available from the corresponding author upon reasonable request.