
Figures & data
Figure 1. mRNA and protein expression of SRPK1 in CESC samples.
(a) The mRNA level of SRPK1 was exhibited as transcripts per million (TPM), which was retrieved from TCGA database. Each red dot represents one sample data of CESC (n = 306), each green dot represent one sample data from normal cervix (n = 13). (b) Patients in TCGA database was divided to high-SRPK1 group (n = 146) and low-SRPK1 group (n = 145). Kaplan–Meier method was used to generate the disease-free survival curve according to the mRNA level of SRPK1. (c) Similarly, the overall survival curves were plotted and tested via log-rank test, which revealed that higher SRPK1 TPM level indicates poorer overall survival (P = 0.018). (d) Representative IHC images showing the high SRPK1 (left panel) and low SRPK1 (right panel) staining in CESC tissues. Magnification: 400X.
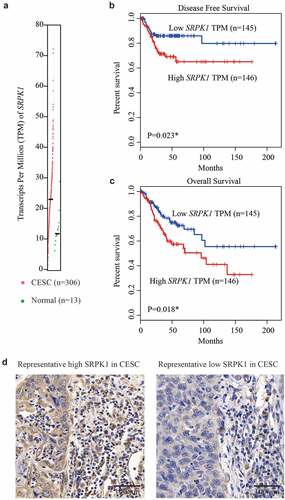
Table 1. Correlation between SRPK1 protein expression and clinicopathologic characteristics of CSCC patients
Figure 2. Disease-free survival analyses.
Kaplan–Meier method was utilized to evaluate the prognostic significances of all variables, including age (a), HPV infection (b), horizontal diffusion diameter (c), stromal invasion depth (d), vagina invasion (e), parametrial invasion (f), lymphovascular invasion (g), lymph node metastasis (h), FIGO stage (i), and SRPK1 expression (j). Data was analyzed by Kaplan–Meier method, and survival curves were compared by long-rank test. * P < 0.05.
Table 2. Disease-free survival (DFS) information of enrolled CSCC patients
Table 3. Overall survival (OS) information of enrolled CSCC patients
Figure 3. Overexpressing SRPK1 promotes CESC proliferation, migration, and invasion.
(a) The transfection efficiencies were tested via Western blot in both C-33A and SW756 cells. (b) MTT assays were used to plot the cell proliferation curves, showing the significant effect of SRPK1 on facilitating CESC cell proliferation. (c) Transwell experiments demonstrated that SRPK1-transfection can enhance CESC migration capacity. (d) Matrigel-Transwell data revealed the role of SRPK1 on promoting CESC invasion.Data were obtained from three independent repeats and presented as mean + SD. * P < 0.05 by Student’s t-test.
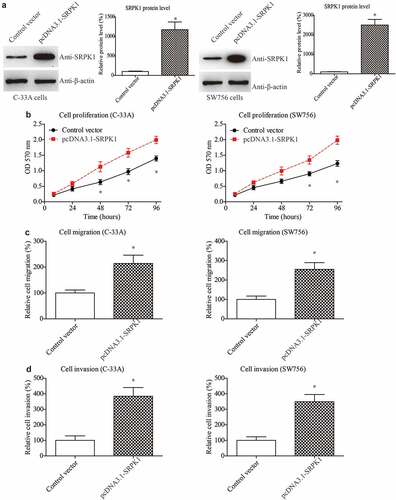
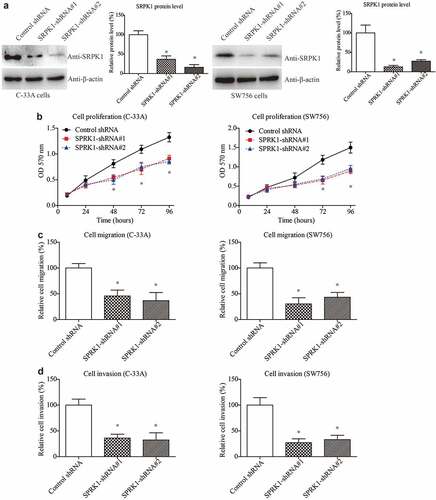
Figure 4. SRPK1 interference results in attenuated CESC viability.
(a) Knockdown efficiencies of shRNAs were tested via Western blot in both C-33A and SW756 cells. (b) MTT assays showed significant effects of SRPK1-shRNAs on inhibiting CESC cell proliferation. (c) Transwell data demonstrated that silencing SRPK1 suppressed CESC migration. (d) Matrigel-Transwell results validated the invasion-suppressing role of SRPK1 interference. Data were obtained from three independent repeats and presented as mean + SD. * P < 0.05.
Supplemental material