
Figures & data
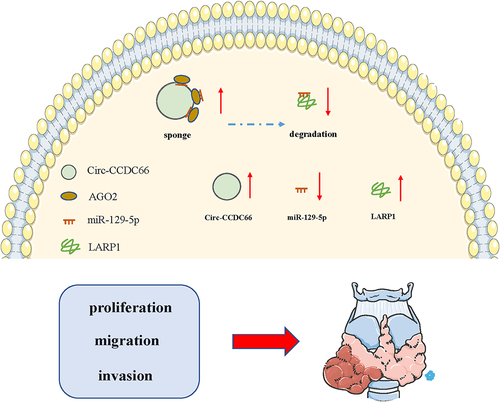
Table 1. Sequences of primers for qRT-PCR
Table 2. Relationship between circ-CCDC66 expression and the clinical pathological characteristics of PTC patients (n = 60)
Figure 1. Circ-CCDC66 is upregulated in PTC and correlated to poor prognosis.
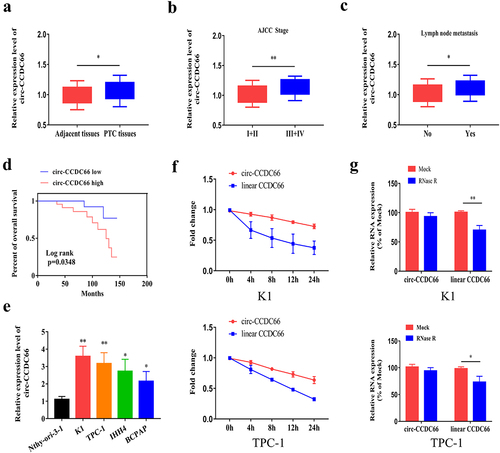
Figure 2. Knockdown of circ-CCDC66 suppressed proliferative, migratory and invasive capacities of PTC.
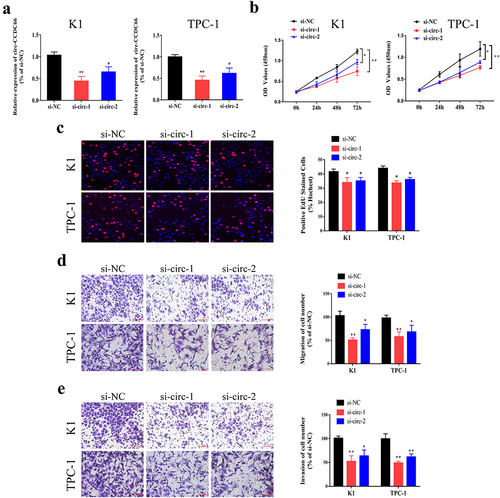
Table 3. Relationship between miR-129-3p expression and the clinical pathological characteristics of PTC patients (n = 60)
Figure 3. Circ-CCDC66 could bind miR-129-5p.
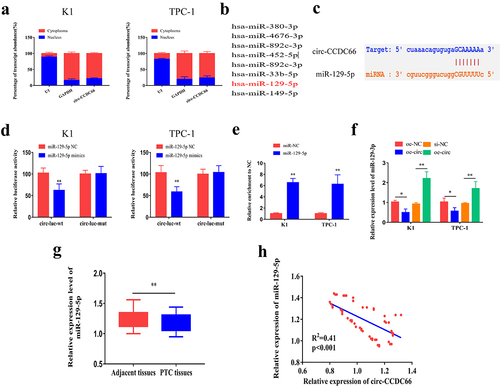
Table 4. Relationship between LARP1 expression and the clinical pathological characteristics of PTC patients (n = 60)
Figure 4. miR-129-5p could bind LARP1.
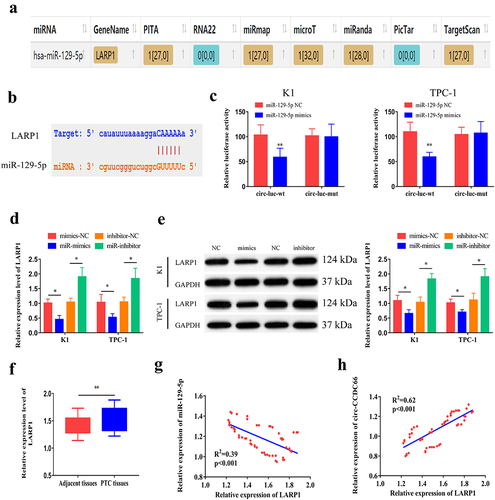
Figure 5. Circ-CCDC66 was involved in the development of PTC through the miR-129-5p/LARP1 axis.
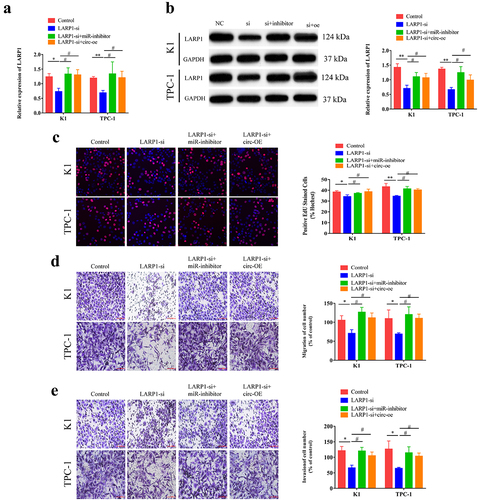
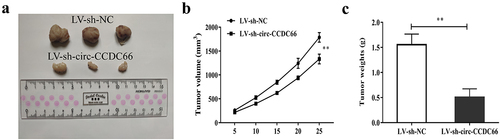
Figure 6. Inhibition of circ-CCDC66 could suppress PTC tumor growth.
Supplemental Material
Download Zip (8 MB)Data availability statement
All data included in this study are available upon request by contacting the corresponding author.