
Figures & data
Table 1. Specific primers for qRT-PCR
Table 2. Relationship between different hsa_circ_0005230 expression and clinicopathological features of GC
Figure 1. The biological structure of hsa_circ_0005230 and its expression in GC tissues and cells.
(a) Schematic diagram showed that according to the junction from back-splice of hsa_circ_0005230 designed the divergent primers. (b) Hsa_circ_0005230 was derived from DNM3OS exon 2, 3, and part of 4. (c) Sanger sequenceverified PCR amplification products of hsa_circ_0005230 were correct. (d) The expression of hsa_circ_0005230 was up-regulated in GC cell lines, compared with GES-1. (e) Hsa_circ_0005230 was up-regulated expression in 130 cases of GC tissues using qRT-PCR. The data were expressed as mean ± SD; *P < 0.05.
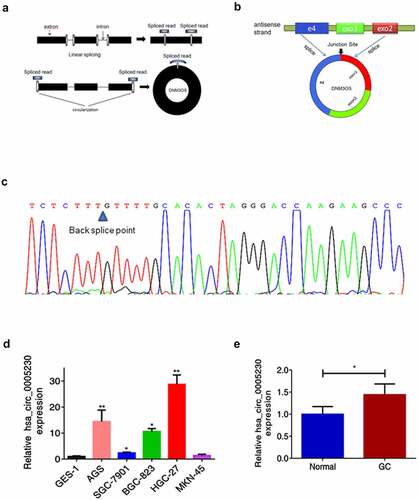
Figure 2. Silencing hsa_circ_0005230 not only diminished the capacities of clone formation and proliferation of GC cells but also arrested the cell cycle.
(a) Utilizing qRT-PCR assay, compared with the NC group, si-circ-0005230-1 was effectively silenced in AGS. (b) Utilizing qRT-PCR assay, compared with the NC group, si-circ-0005230-1 was effectively silenced in HGC-27. (c) Clone formation assay observed that, compared with the NC group, silencing hsa_circ_0005230 significantly decreased the number of colonies in AGS and HGC-27 cells. (d) It was observed from the CCK-8 assay, compared with the NC group, silencing hsa_circ_0005230 declined proliferation of AGS and HGC-27 cells. (e) The use of flow cytometric analysis indicated that, compared with the NC group, silencing hsa_circ_0005230 arrested cell cycle progression in AGS and HGC-27 cells. The data were expressed as mean ± SD; *P < 0.05, **P < 0.01, ***P < 0.001.
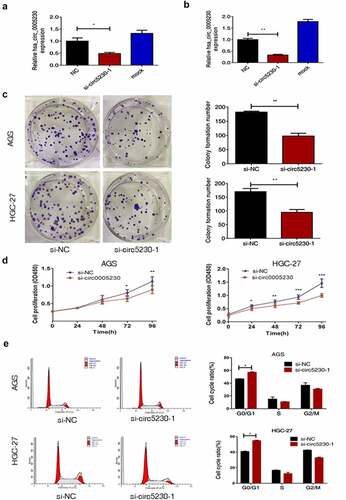
Figure 3. Silencing hsa_circ_0005230 inhibited the invasion and migration of GC cells.
(a) The cell transwell invasion assay observed that silencing hsa_circ_0005230 expression decreased the potential capacity of GC cell invasion, compared with the NC group. (b) The cell transwell migration assay observed that silencing hsa_circ_0005230 expression inhibited the potential capacity of GC cell migration, compared with the NC group. (c) The scratch wound assay observed that silencing hsa_circ_0005230 expression inhibited the migratory capacity of AGS cells, compared with the NC group. (d) The scratch wound assay observed that silencing hsa_circ_0005230 expression inhibited the migratory capacity of HGC-27 cells, compared with the NC group. (e) Applying WB detected the changes of major protein expression of the EMT phenotype after silencing hsa_circ_0005230. The data were expressed as mean ± SD; *P < 0.05, **P < 0.01, ***P < 0.001.
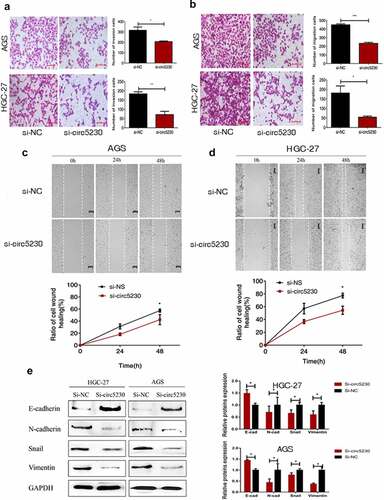
Figure 4. Hsa_circ_0005230 as a sponge to bind miR-1299.
(a) It was predicted from the Circinteractome, 14 miRNAs have binding sites to hsa_circ_0005230. (b) The graph of Targetscan showed the predicted binding sites between miR-1299 and hsa_circ_0005230. (c) MiR-1299 expression was down-regulation in GC cells and 33 cases of GC tissues by qRT-PCR. (d) After silencing hsa_circ_0005230, it was detected miR-1299 was up-regulated expression in AGS and HGC-27 by qRT-PCR. (e) Hsa_circ_0005230 was negatively correlated with miR-1299 at the level of GC tissues. (f) Survival analysis from Kaplan-Meier indicates that survival is longer in GC patients with high miR-1299 expression. The data were expressed as mean ± SD; *P < 0.05, **P < 0.01.
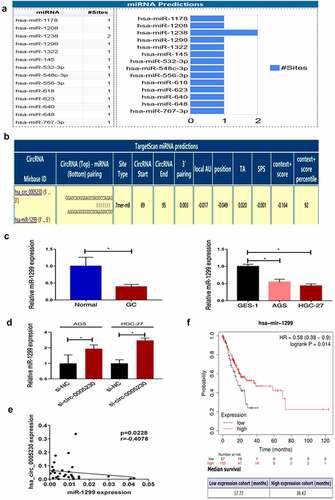
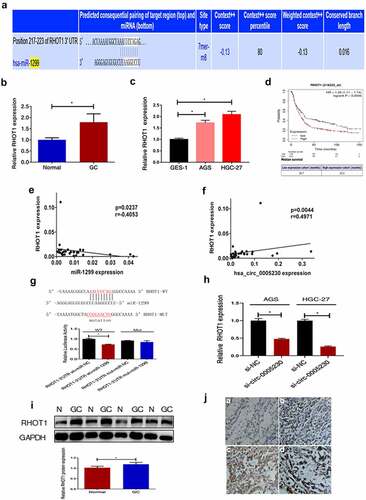
Figure 5. RHOT1 was the downstream target gene of the hsa_circ_0005230/miR-1299 axis.
(a) As can be seen from the graph, miRWalk predicted that miR-1299 had a binding site with RHOT1. (b) RHOT1 was up-regulated in 51 cases of GC tissues by qRT-PCR. (c RHOT1 was up-regulated in GC cells by qRT-PCR. (d) An analysis of Kaplan–Meier survival indicated that GC patients with high expression of RHOT1 experienced short survival. (e) Correlations between miR-1299 and RHOT1 were confirmed at the level of GC tissue. (f) Correlations between hsa_circ_0005230 and RHOT1 were confirmed at the level of GC tissue. (g) The dual-luciferase reporter assay was conducted to verify the binding target relation between RHOT1 and miR-1299. (h) After silencing hsa_circ_0005230, the expression of RHOT1 was decreased in AGS and HGC-27 cells. (I) RHOT1 protein was up-regulated in 48 cases of GC tissues by WB. (j) Immunohistochemical staining showed RHOT1 proteins were localized to cell cytoplasm and have a positive expression in GC cells. (a. normal gastric mucosa; b. poorly differentiated adenocarcinoma without lymph node metastasis; c. The poorly differentiated adenocarcinoma with lymph node metastasized; d. mucinous adenocarcinoma). The data were expressed as mean ± SD; *P < 0.05, **P < 0.01.
Supplemental material