Figures & data
Table 1. The sequences of all primers
Figure 1. Determination of optimal urolithin A concentration for cell treatments. The viability of RAW264.7 cells treated with different concentrations of urolithin A (UA) for 12 h (a), 24 h (b), 48 h (c), 72 h (d), and 96 h (e) is compared with the viability of untreated cells (*P < 0.05). The cell viability was determined by a cell counting kit-8 assay.
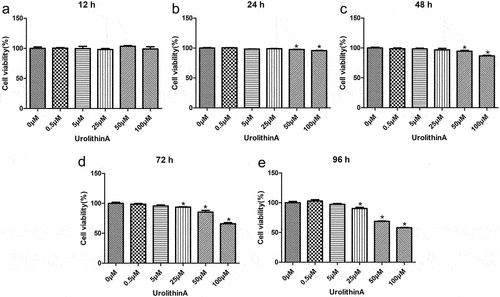
Figure 2. Urolithin A effects on osteoclasts differentiated from RANKL-treated RAW264.7 cells. (a) Tartrate-resistant acid phosphatase (TRACP) levels in RAW264.7 cells subject to RANKL or UA treatment. mRNA expression levels of (b) TRAP, C) NFATC1, and D) c-Fos in RAW264.7 cells subject to RANKL or UA treatment. *P < 0.05 represents significance compared with the control group, and #P < 0.05, compared with the RANKL-treated group.
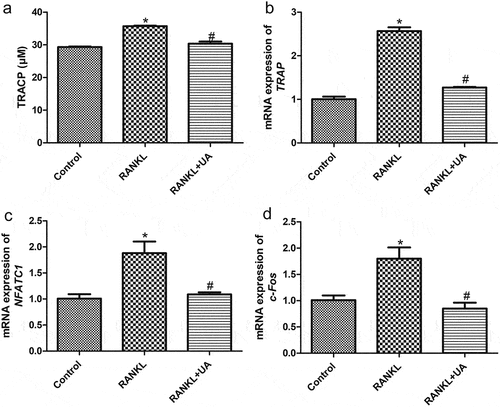
Figure 3. Identifying differentially expressed genes in RAW264.7 cells treated with RANKL or RANKL and UA. (a) Pearson’s correlation coefficients for each total RNA sample isolated from RANKL- or RANKL + UA-treated cell group. (b) A volcano plot of the differentially expressed genes (DEGs). The blue points represent downregulated genes, the gray points normal expression levels, and the red points upregulated genes. (c) Clustering heatmap based on the expression level of the identified DEGs.
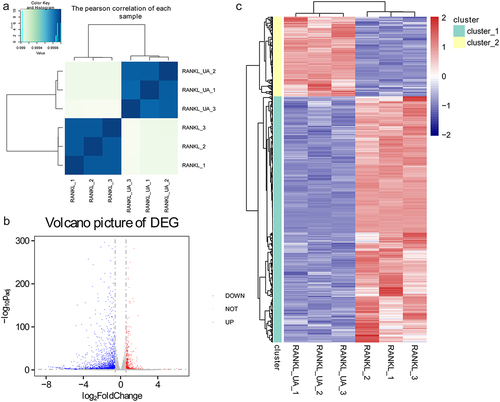
Figure 4. Functional annotation analyses of DEGs identified by sequencing RAW264.7 cells treated with RANKL or RANKL and UA. Gene ontology (GO) terms related to (a) biological process, (b) cellular components, and (c) molecular function are shown. (d) DEGs subject to the Kyoto Encyclopedia of Genes and Genomes (KEGG) pathway analysis are most enriched in signaling pathways related to stress, inflammation, differentiation, and disease.
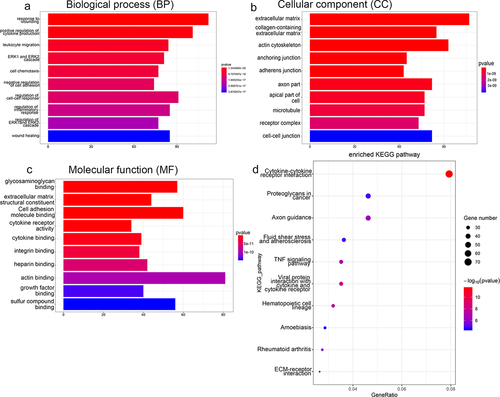
Figure 5. Verifying DEGs by reverse transcription-quantitative PCR. The relative mRNA expression of (a) BMP2, (b) Cebpa, (c) Clec4a3, (d) Mapk1ip1, (e) MMP3, (f) MMP9, (g) RUNX2, and (h) RUNX3 in RANKL- or RANKL + UA-treated RAW264.7 cells. *P < 0.05 depicts significance compared with the RANKL-treated cell group. (i) The BMP2 protein expression detected by Western blotting. *P < 0.05 is significance compared with the control group; #P < 0.05, with the RANKL-treated group.
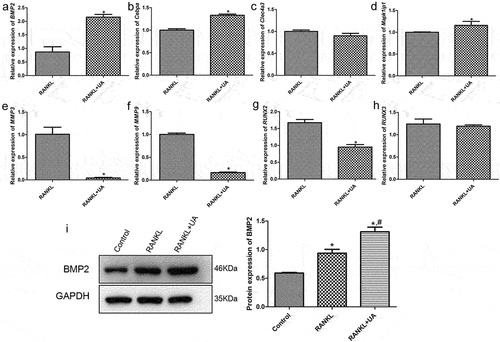
Figure 6. Effects of BMP2 on bone metabolism determined by gene silencing and scanning electron microscopy. (a) Cell transfection efficiency of shBMP2-RAW264.7 cells was assessed by quantifying BMP2 expression with RT-qPCR. *P < 0.05 shows significance compared with shNC-RAW264.7 cells (negative control). (b) Representative scanning electron images of bone biopsy specimens on RANKL and UA treatments in the presence of shBMP2-RAW264.7 or shNC-RAW264.7 cells. (c) The bone biopsy area was quantified using the ImageJ software. *P < 0.05 represents significance compared with the RANKL-treated group; #P < 0.05, compared with the RANKL + UA-treated group.
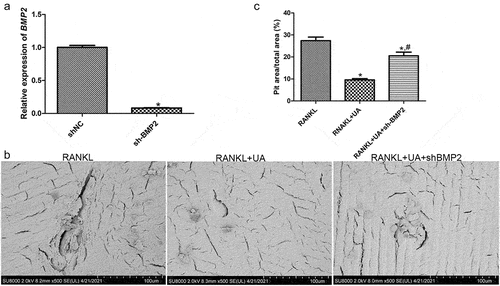
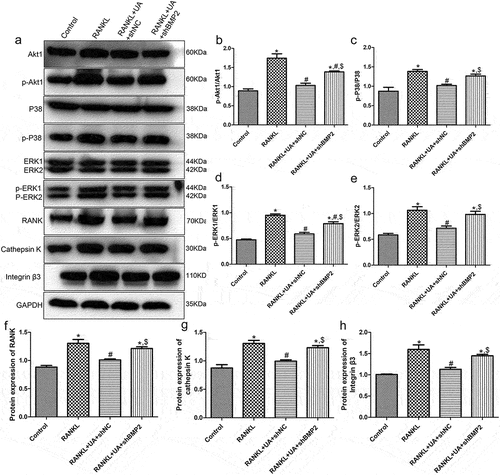
Figure 7. Protein expression levels of Akt1/p38/ERK pathway-related proteins and osteoclastic proteins RANK, cathepsin K, and integrin β3 detected by Western blotting. (a) Representative Western blot images. The levels of (b) phosphorylated (p)-Akt1/Akt1, (c) p-P38/P38, (d) p-ERK1/ERK1, (e) p-ERK2/ERK2, (f) RANK, (g) cathepsin K, and (h) integrin β3 are shown. *P < 0.05 shows significance compared with the untreated shNC group; #P < 0.05, with the RANKL-treated shNC group; $P < 0.05, with the RANKL + UA-treated shNC group.