
Figures & data
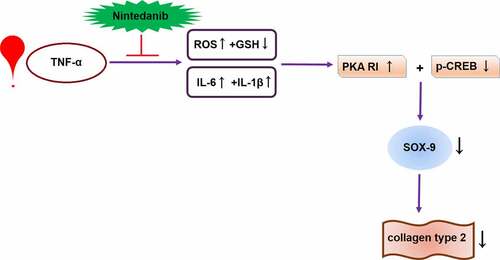
Figure 1. Cytotoxicity of Nintedanib in CHON-001 chondrocytes. Cells were treated with 0.75, 1.5, 7.5, 15, 75, and 150 μM for 24 hours. (a). Molecular structure of Nintedanib; (b). Cytotoxicity was assayed by measuring LDH release (#, ##, P < 0.05, 0.01 vs. Vehicle group).
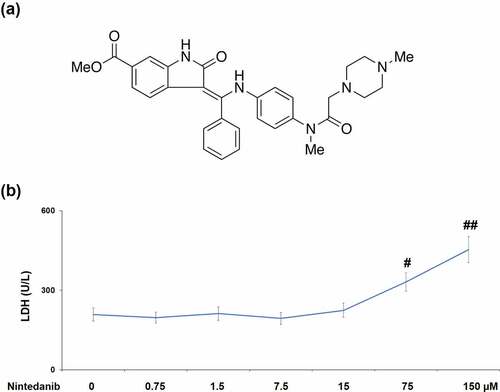
Figure 2. Nintedanib ameliorated TNF-α-induced oxidative stress in CHON-001 chondrocytes. Cells were stimulated with TNF-α (10 ng/mL) with or without Nintedanib (7.5, 15 μM) for 24 hours. (a). Intracellular levels of ROS; (b). The levels of reduced GSH (####, P < 0.0001 vs. Vehicle group; **, ***, P < 0.01, 0.001 vs. TNF-α group).
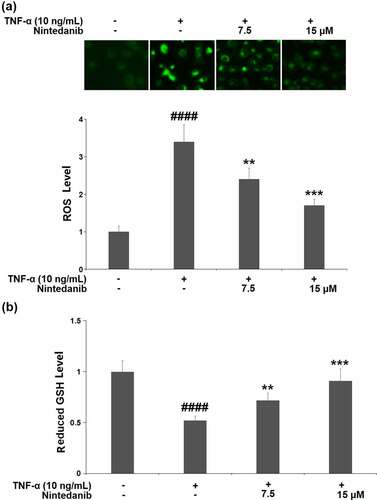
Figure 3. Nintedanib inhibited the TNF-α-induced expression of pro-inflammatory cytokines such as IL-6 and IL-1β. Cells were stimulated with TNF-α (10 ng/mL) with or without Nintedanib (7.5, 15 μM) for 24 hours. (a). mRNA of IL-6 and IL-1β; (b). Secretions of IL-6 and IL-1β (####, P < 0.0001 vs. Vehicle group; **, ***, P < 0.01, 0.001 vs. TNF-α group).
Figure 4. Nintedanib restored the decrease in the expression of collagen type II. (a). Gene of COL2A1; (b). Protein of collagen type II (####, P < 0.0001 vs. Vehicle group; **, ***, P < 0.01, 0.001 vs. TNF-α group).
Figure 5. Nintedanib prevented the TNF-α-induced reduction of SOX-9. (a). mRNA levels of SOX-9; (b). Protein levels of SOX-9 (####, P < 0.0001 vs. Vehicle group; **, ***, P < 0.01, 0.001 vs. TNF-α group).
Figure 6. Nintedanib restored the levels of PKA RI and p-CREB against TNF-α. Cells were stimulated with TNF-α (10 ng/mL) with or without Nintedanib (7.5, 15 μM) for 6 hours. (a). The expression of PKA RI; (b). The levels of p-CREB (####, P < 0.0001 vs. Vehicle group; **, ***, P < 0.01, 0.001 vs. TNF-α group).
Figure 7. Blockage of the PKA/CREB signaling with H89 abolished the protective effects of Nintedanib against TNF-α- induced reduction of SOX-9 and collagen type II. Cells were stimulated with TNF-α (10 ng/mL) with or without Nintedanib (15 μM) and H89 (10 μM) for 24 hours. (a). Gene levels of SOX-9; (b). Protein levels of SOX-9; (c). Protein levels of type 2 collagen (####, P < 0.0001 vs. Vehicle group; **, ***, P < 0.01, 0.001 vs. TNF-α group).
Data availability statement/availability of data materials
The data that support the findings of this study are available from the corresponding author upon reasonable request.