Figures & data

Table 1. Correlations between MTL5 and clinicopathologic characteristics
Figure 1. mRNA and protein expression of MTL5 in CESC.
(a) mRNA level of MTL5 was evaluated by RT-qPCR in 17 pairs of fresh-resected CESC tumor tissues and nontumorous ovarian tissues, indicating that CESCs possess higher MTL5-mRNA levels compared to normal cervical tissues. Data was analyzed by paired Student’s t-test (P = 0.002). (b) Representative high protein level of MTL5 in CESC tissues, showing predominant nucleus localization. (c) Representative low-protein immunostaining of MTL5 in CESC tissues. (d-f) Box plots showed the differential MTL5 protein expression in CESC tissues with different horizontal diameters (d), lymph node status (e), and FIGO stages (f). The Y-axis was presented as the IHC score of MTL5 in CESC tissues. Data was shown as mean ± SD and compared by unpaired Student’s t-test.
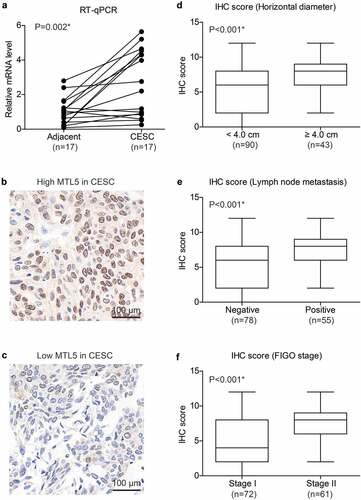
Table 2. Disease-free survival (DFS) analyses by Kaplan–Meier method and log-rank test
Figure 2. Disease-free survival analyses of CESC cohort.
Kaplan–Meier method was used to analyze the prognostic significances of retrieved clinicopathological characteristics, such as MTL5 protein level (a), age at diagnosis (b), horizontal diffusion diameter (c), stromal invasion depth (d), parametrial invasion (e), lymphovascular invasion (f), lymph node metastasis (g), and FIGO stage (h). Data was analyzed by log-rank test.
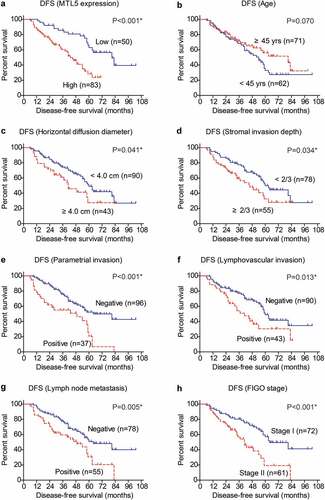
Figure 3. The mRNA level of MTL5 and its clinical significance in TCGA database.
(a) The mRNA level of MTL5 in CESC tissues was extracted from TCGA database. By analyzing the transcripts per million (TPM) level of MTL5 in CESC tissues (n = 306) and normal cervix tissues (n = 13), we found that MTL5-mRNA level was significantly higher in CESC tissues (P < 0.001). (b) Relationship between MTL5-mRNA level and overall survival of CESC patients was plotted by Kaplan–Meier method, which indicated an unfavorable effect of MTL5 on CESC prognosis.
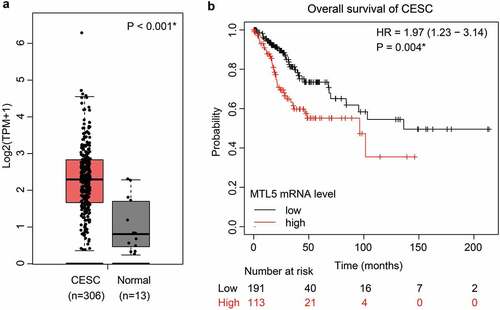
Table 3. Multivariate analysis by Cox regression model
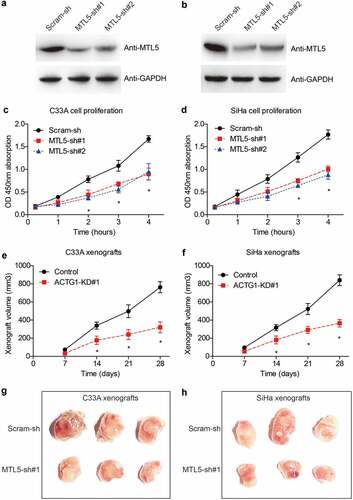
Figure 4. The effects of MTL5 on CESC proliferation and growth.
(a, b) Two shRNAs targeting MTL5 (MTL5-sh#1 and MTL5-sh#2) as well as scrambled shRNA (Scram-sh) were transfected into C33A and SiHa cell lines, respectively. The knockdown efficiencies were tested by Western blotting. (c, d) CCK-8 assays reflected that MTL5-shRNA can significantly attenuate the proliferation of both C33A and SiHa cell lines. (e, f) The growth curves of xenografts generated by MTL5-sh#1 cells and Scram-sh cells showed that MTL5 interference remarkably impaired CESC tumor growth in vivo. (g, h) Images showed significantly different xenograft size after tumor isolation.