Figures & data
Figure 1. RAB27B was increased in AML patients. (a-b) The expression of RAB27B and overall survival in AML patients. *P < 0.05. (c-d) The protein and mRNA levels of RAB27B in AML cells. The results are representative of four independent experiments. The data were shown in mean ± SD.***P < 0.001.
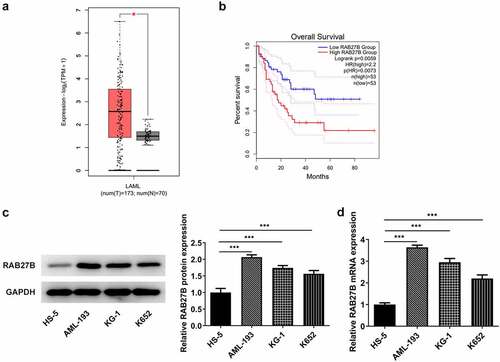
Figure 2. Suppression of RAB27B reduced the proliferation of AML cells. (a-b) The protein and mRNA levels of RAB27B after transfection by Western blot and RT-qPCR analysis. (c)The OD value at 450 nm by CCK8 assay and (d) expression of Ki67 and PCNA after transfection of siRNA-RAB27B-1, siRNA-RAB27B-2 or siRNA-NC for 24 h by Western blot analysis. Each experiment was repeated at least three times. The data were shown in mean ± SD. **P < 0.01, ***P < 0.001.
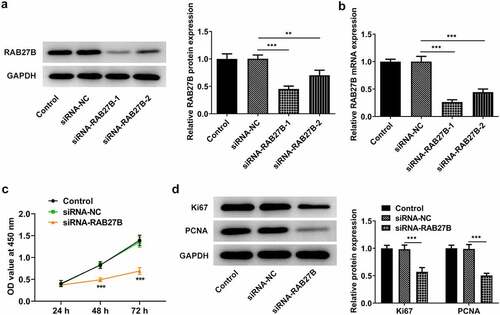
Figure 3. Suppression of RAB27B promoted the cell cycle arrest at G0/G1 phase and the cell apoptosis. (a-b) Cell cycle and expression of CDK2 and p21 were determined in AML cells targeted by si-RAB27B by flow cytometry and Western blot analysis. (c-d) The cell apoptosis and apoptosis-related markers were determined in AML cells targeted by si-RAB27B by TUNEL staining and Western blot analysis. Each experiment was repeated at least three times. The data were shown in mean ± SD. ***P < 0.001.
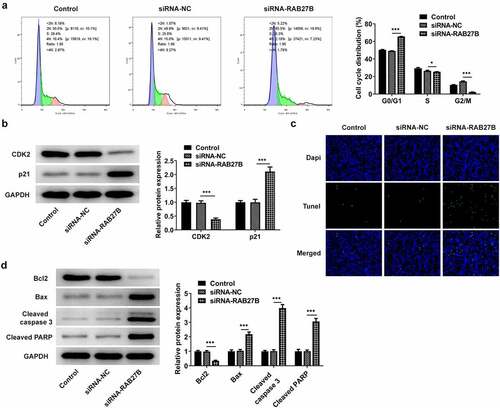
Figure 4. RAB27B could combine with BDH2. (a) The expression of BDH2 in AML cells by the detection of RT-qPCR. (b) The targeting relationship between RAB27B and BDH2 was confirmed by IP. (c) The expression of BDH2 in AML cells targeted by si-RAB27B by Western blot analysis. Each experiment was repeated at least three times. The data were shown in mean ± SD. * **P < 0.001.

Figure 5. RAB27B suppressed the proliferation of AML-193 cells by binding to BDH2. (a) The protein levels of BDH2after transfection of Ov-BDH2. (b) The OD value at 450 nm by the analysis of CCK8 assay and (c) expression of Ki67 and PCNA after co-transfection. Each experiment was repeated at least three times. The data were shown in mean ± SD. **P < 0.01, ***P < 0.001.
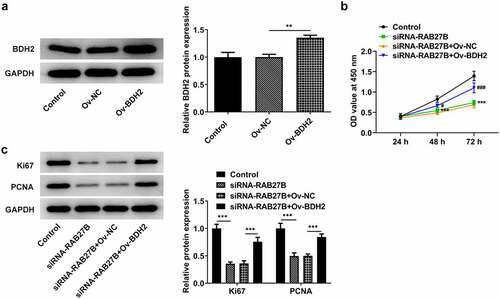
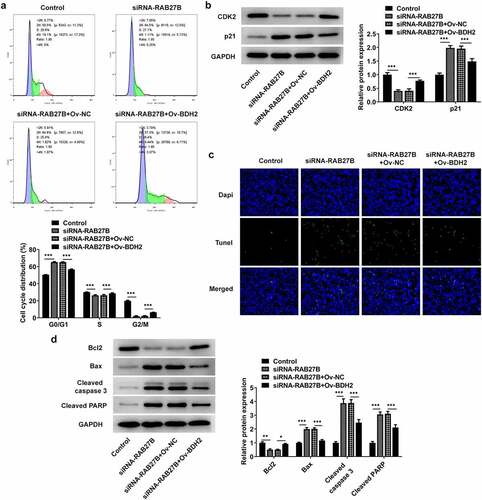
Figure 6. Suppression of RAB27B promoted the cell cycle arrest at G0/G1 phase and the cell apoptosis by binding to BDH2. (a-b) Cell cycle by the analysis of flow cytometry and expression of CDK2 and p21 were determined in AML cells after co-transfection. (c-d) The cell apoptosis and apoptosis-related markers were determined in AML cells after co-transfection. Each experiment was repeated at least three times. The data were shown in mean ± SD. *P < 0.05, **P < 0.01 and ***P < 0.001.