Figures & data
Table 1. Correlations between OIP5-AS1 and clinical characteristics of NSCLC patients
Figure 1. The expression of OIP5-AS1 and PD-L1 in NSCLC. The expression levels of OIP5-AS1 mRNA (a) and PD-L1 mRNA (b) were both elevated in NSCLC tumor and non-tumor samples. *, p < 0.05. IHC was used to detect PD-L1 protein in 5 pairs of NSCLC tumor tissues and non-tumor tissues from 5 patients (c). In all 5 cases, the expression of PD-L1 protein was much stronger in NSCLC tumors compared to that in normal non-tumor tissues.
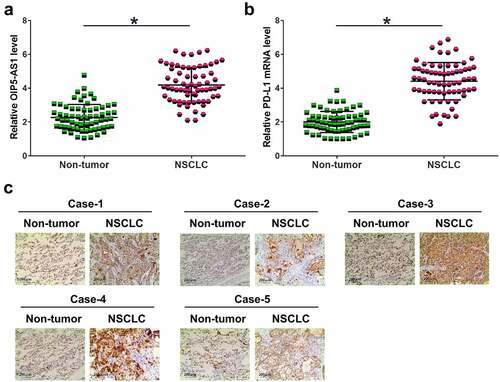
Figure 2. OIP5-AS1 and PD-L1 were positively correlated in NSCLC. Correlations between OIP5-AS1 and PD-L1 mRNA expression in NSCLC tissues (a) and non-tumor tissues (b) were studied with Pearson’s correlation coefficient. p < 0.01 for tumor samples; p = 0.7276 for non-tumor samples.
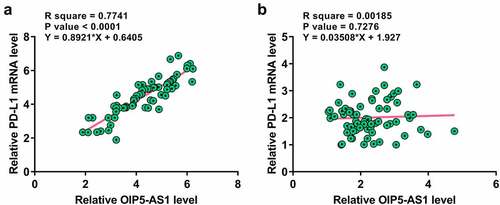
Figure 3. Both OIP5-AS1 and PD-L1 mRNAs were elevated with the increase of clinical stages. The 68 NSCLC patients were classified into three clinical stages according to the severity and clinical standard. There were 16, 20 and 32 patients subgrouped at clinical stage II–IV respectively. The expression levels of OIP5-AS1 (a) and PD-L1 (b) were both elevated with the increase of clinical stages. **, p < 0.01.
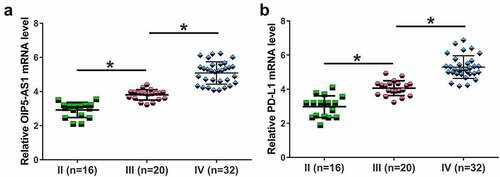
Figure 4. OIP5-AS1 upregulated PD-L1 in H23 cells by targeting miR-34a. The prediction of RNAs interaction was performed by IntaRNA (a). By co-transfecting OIP5-AS1 expression vector plus negative control miRNA (NC group) or miR-34a mimic (miR-34a group) into 106 cells, dual luciferase reporter assay was also conducted (b). The luciferase activity was significantly inhibited in miR-34a group. RNA pull down was conducted (c). OIP5-AS1 cDNA could be only amplified in the precipitation pulled down by miR-34a probe but not control probe. Overexpression of OIP5-AS1, silence of OIP5-AS, overexpression of miR-34a and overexpression of PD-L1 were confirmed by RT-qPCR at 36 h post-transfection (d). Effects of OIP5-AS1 overexpression, silence and miR-34a overexpression on PD-L1 mRNA and protein expression (e). The regulatory relationship between miR-34a and OIP5-AS1 was evaluated by RT-qPCR. Overexpression of OIP5-AS1 significantly inhibited miR-34a expression (f). PD-L1 expression was detected by RT-qPCR (g). The differences between two groups were analyzed by unpaired t-test. *, p < 0.05.
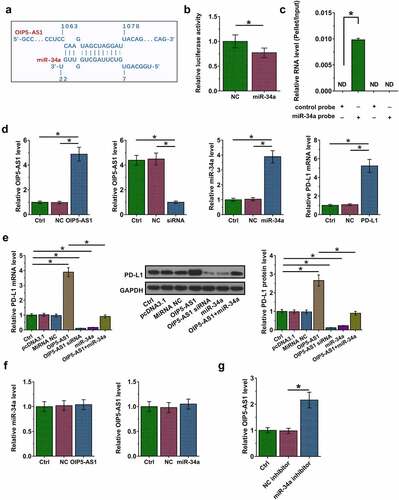
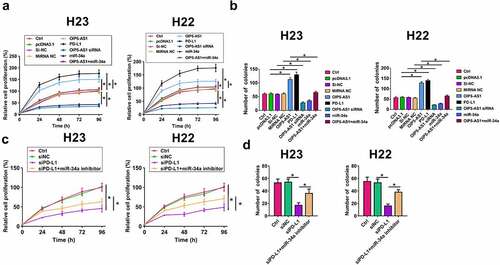
Figure 5. OIP5-AS1 targets miR-34a and regulates PD-L1. Cell proliferation was analyzed by CCK-8 (a) and colony formation assay (b) in H23 and H22 cells. Both overexpression of OIP5-AS1 and PD-L1 significantly promoted cell proliferation, while silencing of OIP5-AS1 and overexpression of miR-34a had opposite effects. To further confirm the roles of above RNAs in cell proliferation, colony formation assay was conducted. Both OIP5-AS1 and PD-L1 overexpression significantly increased cell colony number. However, OIP5-AS1 silence and miR-34a overexpression had opposite effects. The proliferation (c) and colonies (d) was measured by Cell proliferation analysis in H23 and H22 cells transfected with siNC, siPD-L1, and siPD-L1+ miR-34a. *, p < 0.05.