Figures & data
Table 1. Primer sequences
Figure 1. Circ_0068464 expressions in colorectal cancer tissues and cells. (a) GEO database and the intersection of DNA arrays were utilized to explore CRC-related circRNA; (b–c) QRT-PCR was applied to determine circ_0068464 expression in CRC tissues (b), ** P < 0.01 vs. Normal group) and in CRC cell line (C, *P < 0.05 vs. FHC group); (d) RNaseR digestion was used to verify the ring structure of circ_0068464 in HCT116 and LS174T cells, ***P < 0.001 vs. Mock group; (e) FISH experiments were performed to detect the subcellular localization of circ_0068464.
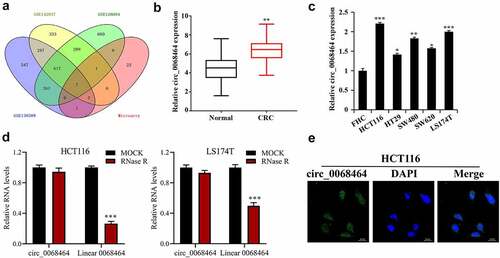
Figure 2. Effects of knockdown of circ_0068464 on malignant phenotype of colorectal cancer cells. (a) The expression of circ_0068464 in the cells in each group was detect using qRT-PCR. For HCT116 or LS174T cells, (b) MTT was utilized to measure proliferation rate; (c-e) flow cytometry was carried out to check the cycle (c) and apoptosis rate (e); (d) transwell was adopted to determine the abilities of migration; (f) Western blot was adopted to check MMP-2 and MMP-9 expression. **P < 0.01 vs. siNC group.
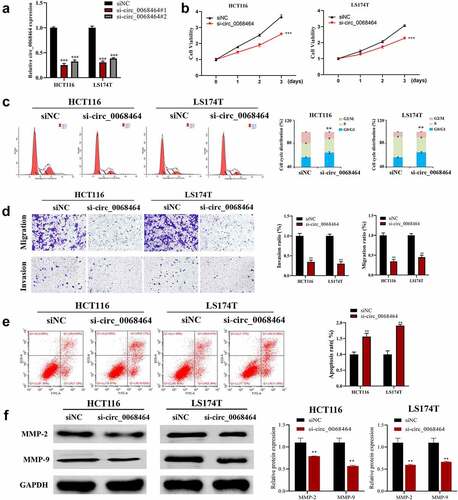
Figure 3. The correction between circ_0068464 and miR-383 in colorectal cancer. (a) The binding site between miR-383 and circ_0068464 was predicted by bioinformatics website; (b–c) dual-luciferase (b) and RIP (c) were applied to determine the targeted relationship between circ_0068464 and miR-383, **P < 0.01 vs. anti-IgG group; (d-e) QRT-PCR was utilized to check miR-383 expression in colorectal cancer tissues (d) and cells of each group (e), **P < 0.01 vs. Normal group; **P < 0.01 vs. siNC group; **P < 0.01 vs. NC group; (f) Pearson correlation analysis was utilized check the expression of correlation between circ_0068464 and miR-383 in colorectal cancer tissues.
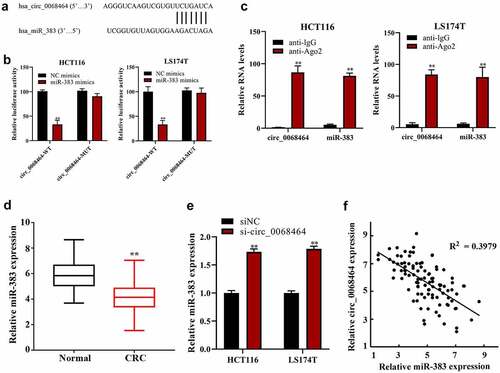
Figure 4. Effects of knockdown of miR-383 on circ_0068464 in colorectal cancer cells. (a) MTT was utilized to determine the proliferation rate of LS174T or HCT116 cells; (b) Transwell assay was applied to check the migration of HCT116 or LS174T cells; (c–d) flow cytometry was applied to check the cycle (c) and apoptosis (d) of HCT116 or LS174T cells; (e) Western blot was utilized to determine MMP-2 and MMP-9 expression in HCT116 or LS174T cells. **P < 0.01 vs. siNC+NC inhibitor group, ## P < 0.01 vs. si-circ_0068464+ NC inhibitor group.
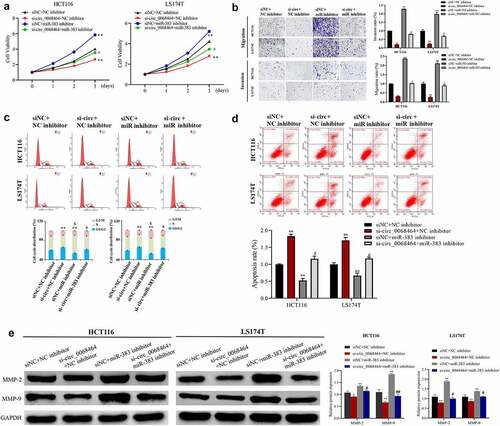
Figure 5. Effects of knockdown of circ_0068464 and miR-383 on Wnt/β-catenin pathway. (a) Western blot was utilized to detect the protein expression of LEF-1, Cyclin D1, C-myc and β-catenin in HCT116 or LS174T cells after knockdown of circ_0068464, **P < 0.01 vs. siNC group; (b) Western blot was applied to check β-catenin, Cyclin D1, C-myc and LEF-1 protein expression in HCT116 or LS174T cells in each group, **P < 0.01 vs. siNC+NC inhibitor group, ##P < 0.01 vs. si-circ_0068464+ NC inhibitor group.
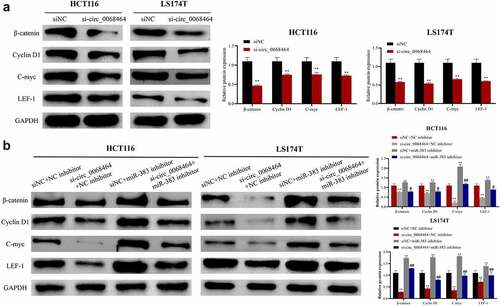
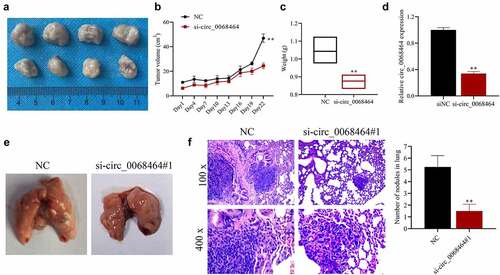
Figure 6. Knockdown of circ_0068464 can suppress the development and lung metastasis of colorectal cancer in vivo. (a) The images (top, NC group; down, si-circ_0068464 group) of tumor tissues of mice; (b–c) volume (b) and weight (c) in tumor tissues of mice in each group; (d) Circ_0068464 expression in tumor tissues of mice in each group was determined using qRT-PCR; (e) the illustrative diagram of lung tissues of mice in each group; (f, h and e) staining was utilized to observe tumor nodules in lung tissues. **P < 0.01 vs. siNC group.