Figures & data
Table 1. Primer sequences used for qRT-PCR
Figure 1. Circ_0020123 level was increased in DDP-resistant NSCLC cells. (a) The qRT-PCR was used to measure circ_0020123 expression in 16HBE cells, NSCLC cells (A549 and H1299) and DDP-resistant NSCLC cells (A549/DDP and H1299/DDP). (b-e) IC50 of DDP was detected by CCK-8 assay in A549 and A549/DDP cells (b-c) or H1299 and H1299/DDP cells (d-e). Each experiment was performed for three times with three parallels each time. Data were exhibited as the mean ± standard deviation (SD). Student’s t-test was used for statistical analysis. *P < 0.05, **P < 0.01.
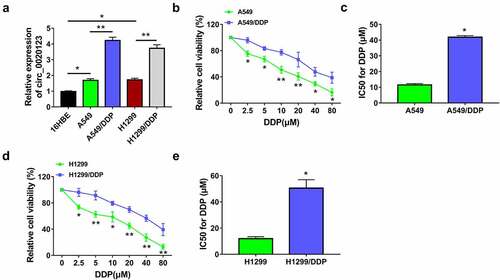
Figure 2. Knockdown of circ_0020123 repressed DDP resistance in NSCLC cells. Transfection of si-NC or si-circ_0020123 was performed in A549/DDP and H1299/DDP cells. (a) Relative expression of circ_0020123 was determined using qRT-PCR. (b) IC50 for DDP was analyzed by CCK-8 assay after different concentrations of DDP treatment. (c-e) Cell proliferation was assessed through CCk-8 assay (c-d) and colony formation assay (e) after 10 µM DDP treatment. (f-g) Cell migration and invasion were examined by transwell assay after 10 µM DDP treatment. (h) Flow cytometry was exploited for detecting cell apoptosis after 10 µM DDP treatment. (i-j) The levels of resistance-related proteins were measured by Western blot after 10 µM DDP treatment. Each experiment was performed for three times with three parallels each time. Data were exhibited as the mean ± standard deviation (SD). Student’s t-test was used for statistical analysis. *P < 0.05, **P < 0.01.
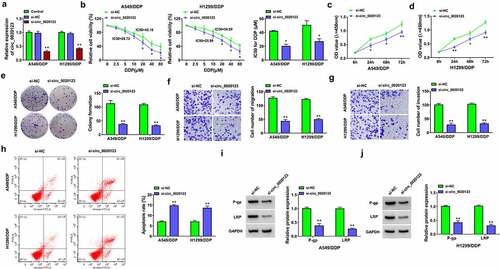
Figure 3. Circ_0020123 acted as a sponge of miR-140-3p. (a) The binding sites between circ_0020123 and miR-140-3p were shown by circinteractome. (b) The expression of miR-140-3p was assayed by qRT-PCR in miR-NC or miR-140-3p transfected A549/DDP and H1299/DDP cells. (c-d) The binding between circ_0020123 and miR-140-3p was validated using dual-luciferase reporter assay. (e) The expression analysis of miR-140-3p was performed by qRT-PCR in DDP-sensitive and resistant cells. (f) The inhibition of anti-miR-140-3p on miR-140-3p level was analyzed via qRT-PCR. (g-h) The qRT-PCR was conducted for miR-140-3p detection after transfection of si-circ_0020123, si-circ_0020123+ anti-miR-140-3p or negative controls. Each experiment was performed for three times with three parallels each time. Data were exhibited as the mean ± standard deviation (SD). Student’s t-test and one-way analysis of variance (ANOVA) followed by Tukey’s test were used for statistical analysis. *P < 0.05, **P < 0.01.
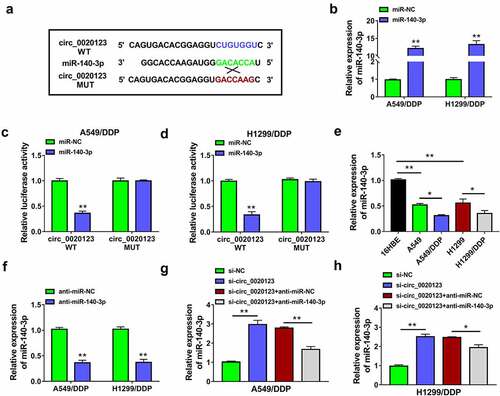
Figure 4. Inhibition of miR-140-3p partly rescued the effect of si-circ_0020123 on DDP resistance in NSCLC cells. Transfection of si-NC, si-circ_0020123, si-circ_0020123+ anti-miR-NC or si-circ_0020123+ anti-miR-140-3p was performed in A549/DDP and H1299/DDP cells. (a-b) CCK-8 assay was carried out to analyze the IC50 for DDP after different concentrations of DDP treatment. (c-e) CCK-8 assay (c-d) and colony formation assay (e) were used for proliferation analysis under 10 µM DDP treatment. (f-g) Transwell assay was applied to evaluate cell migratory or invasive ability under 10 µM DDP treatment. (h) Cell apoptosis was measured by flow cytometry under 10 µM DDP treatment. (i-j) Western blot was implemented for the protein expression detection of P-gp and LRP under 10 µM DDP treatment. Each experiment was performed for three times with three parallels each time. Data were exhibited as the mean ± standard deviation (SD). Student’s t-test and one-way analysis of variance (ANOVA) followed by Tukey’s test were used for statistical analysis. *P < 0.05, **P < 0.01.
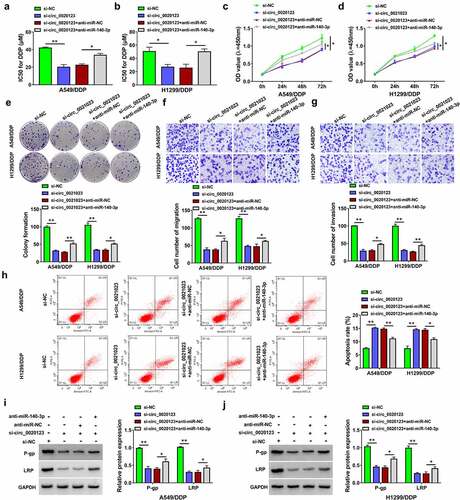
Figure 5. HOXB5 was a target of miR-140-3p. (a) Targetscan was used to predict the binding between miR-140-3p and HOXB5 3ʹUTR. (b-c) Dual-luciferase reporter assay was performed for verifying the interaction between miR-140-3p and HOXB5 3ʹUTR. (d-e) Western blot was applied to examine the protein expression of HOXB5 in 16HBE cells or DDP-sensitive/resistant NSCLC cells (d) and pcDNA or pcDNA-HOXB5 transfected cells (e). (f-g) The protein level of HOXB5 was analyzed by Western blot after transfection of miR-140-3p, miR-140-3p+pcDNA-HOXB5. Each experiment was performed for three times with three parallels each time. Data were exhibited as the mean ± standard deviation (SD). Student’s t-test and one-way analysis of variance (ANOVA) followed by Tukey’s test were used for statistical analysis. *P < 0.05, **P < 0.01.
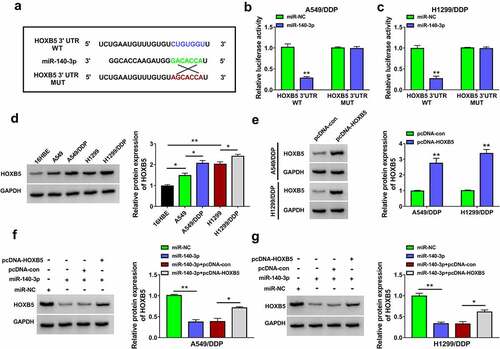
Figure 6. HOXB5 overexpression partly alleviated the inhibition of miR-140-3p in DDP resistance of NSCLC cells. Transfection of miR-NC, miR-140-3p, miR-140-3p+pcDNA-con or miR-140-3p+pcDNA-HOXB5 was performed in A549/DDP and H1299/DDP cells. (a-b) The detection of IC50 for DDP was performed using CCK-8 assay after different concentrations of DDP treatment. (c-e) Cell proliferation ability was analyzed using CCK-8 assay (c-d) and colony formation assay (e) following 10 µM DDP treatment. (f-g) Transwell assay was applied to evaluate cell migration or invasion ability following 10 µM DDP treatment. (h) The assessment of cell apoptosis was completed via flow cytometry following 10 µM DDP treatment. (i-j) The levels of P-gp and LRP were determined through Western blot following 10 µM DDP treatment. Each experiment was performed for three times with three parallels each time. Data were exhibited as the mean ± standard deviation (SD). Student’s t-test and one-way analysis of variance (ANOVA) followed by Tukey’s test were used for statistical analysis. *P < 0.05, **P < 0.01.
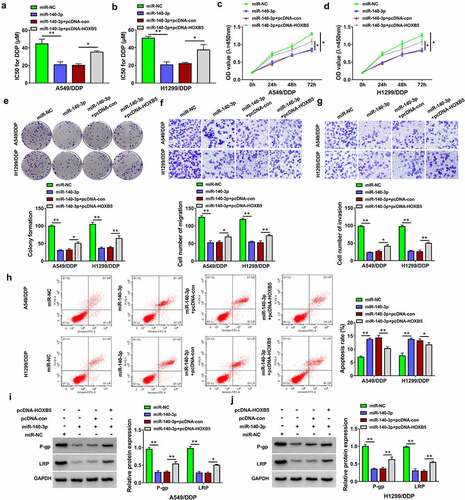
Figure 7. Circ_0020123 regulated the HOXB5 level partly via targeting miR-140-3p. (a-b) Western blot was performed for the measurement of HOXB5 protein level in si-NC, si-circ_0020123, si-circ_0020123+ anti-miR-NC or si-circ_0020123+ anti-miR-140-3p transfection group in A549/DDP (a) and H1299/DDP (b) cells. Each experiment was performed for three times with three parallels each time. Data were exhibited as the mean ± standard deviation (SD). Student’s t-test and one-way analysis of variance (ANOVA) followed by Tukey’s test were used for statistical analysis. *P < 0.05, **P < 0.01.
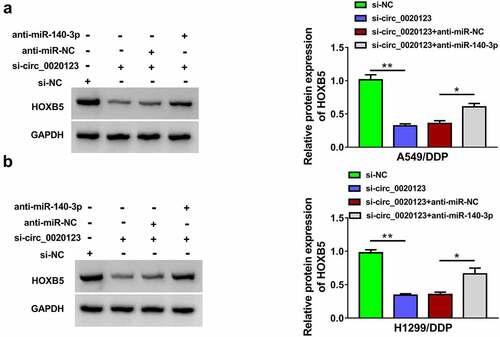
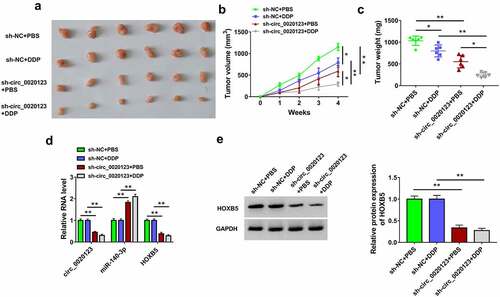
Figure 8. Circ_0020123 inhibition reduced tumor growth of NSCLC in A549/DDP xenograft model partly through the regulation of miR-140-3p/HOXB5 axis. (a) The tumors of sh-NC+PBS, sh-NC+DDP, sh-circ_0020123+ PBS or sh-circ_0020123+ DDP group were excised from mice. (b-c) The measured tumor volume (b) and weight (c) of each group. (C) The expression levels of circ_0020123, miR-140-3p and HOXB5 mRNA were assayed by qRT-PCR. (e) HOXB5 protein level was analyzed using Western blot. Each experiment was performed for three times with three parallels each time. Data were exhibited as the mean ± standard deviation (SD). Student’s t-test and one-way analysis of variance (ANOVA) followed by Tukey’s test were used for statistical analysis. *P < 0.05, **P < 0.01.