
Figures & data

Figure 1. Cytotoxicity of Nintedanib in endothelial cells. Cells were treated with Nintedanib at concentrations of 1, 5, 10, 25, 50, 100 μM. Cell viability was determined with the CCK-8 assay (*, **, P < 0.05, 0.01 vs. Vehicle group).
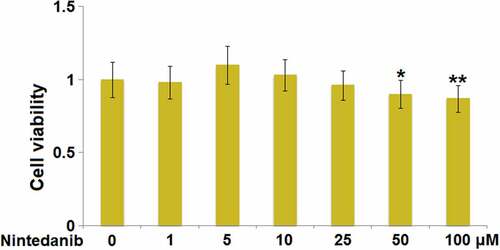
Figure 2. Nintedanib prevents ox-LDL-induced lipid accumulation in HUVECs. Cells were treated with 75 μg/mL ox-LDL with or without 10 μM and 25 μM of Nintedanib for 24 hours. (a). The levels of Total Cholesterol (TC); (b) Free Cholesterol (FC) (***, P < 0.001 vs. Vehicle group; #, ##, P < 0.05, 0.01 vs. ox-LDL group).
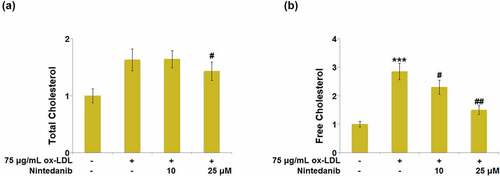
Figure 3. Nintedanib reduces ox-LDL LDL-induced inflammation in HUVECs. (a) mRNA levels of TNF-α, IL-1β, IL-6; (b) Secretion levels of TNF-α, IL-1β, IL-6 (***, P < 0.001 vs. Vehicle group; #, ##, P < 0.05, 0.01 vs. ox-LDL group).
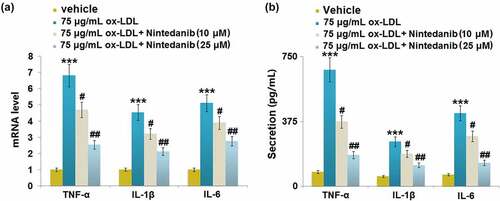
Figure 4. Nintedanib reduces ox-LDL-induced oxidative stress in HUVECs. (a) ROS levels; (b) MDA levels; (c) GSH-Px levels (***, P < 0.001 vs. Vehicle group; #, ##, P < 0.05, 0.01 vs. ox-LDL group).
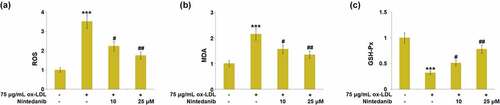
Figure 5. Nintedanib reduces ox-LDL- induced cellular senescence in HUVECs. Cells were treated with 75 μg/mL ox-LDL with or without 10 μM and 25 μM of Nintedanib for 7 days. (a). SA-β-gal staining;(b). Immunoblotting analysis of cellular senescence marker p21 andp53 (***, P < 0.001 vs. Vehicle group; #, ##, P < 0.05, 0.01 vs. ox-LDL group).
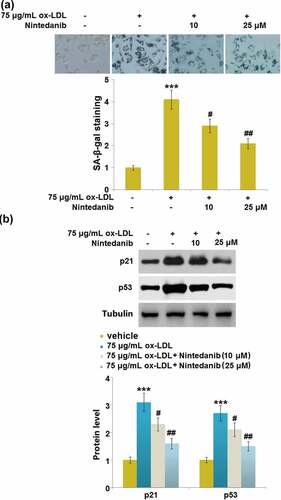
Figure 6. Nintedanib inhibits ox-LDL-induced cell cycle arrest in G0/G1 phase in HUVECs. Cell fraction in the G0/G1phase, G2/M phase, and S phase was calculated (***, P < 0.001 vs. Vehicle group; #, ##, P < 0.05, 0.01 vs. ox-LDL group).
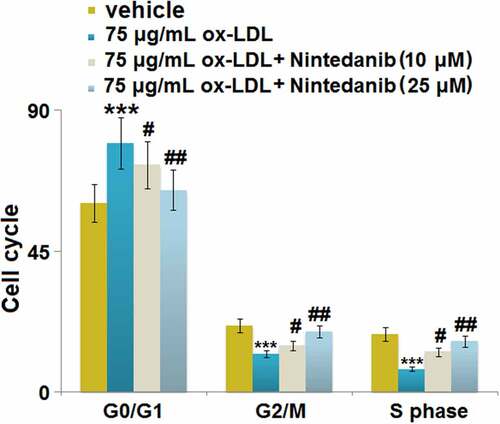
Figure 7. Nintedanib inhibits the expression of Arg-II elevated by ox-LDL treatment in HUVECs. Cells were treated with 75 μg/mL ox-LDL with or without 10 μM and 25 μM of Nintedanib for 24 hours. (a). mRNA of Arg-II; (b). protein level of Arg-II (***, P < 0.001 vs. Vehicle group; #, ##, P < 0.05, 0.01 vs. ox-LDL group).
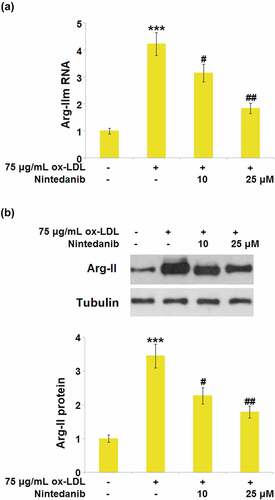
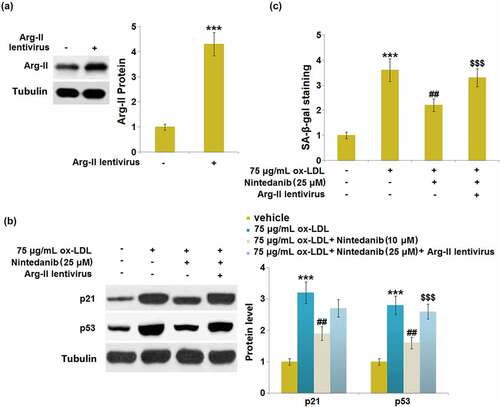
Figure 8. Overexpression of Arg-II blocked the protective effects of Nintedanib on ox-LDL induced and cellular senescence. Cells were infected with Arg-II lentivirus for 48 hours and then treated with 75 μg/mL ox-LDL with or without 25 μM of Nintedanib for 24 hours. (a). Western blot analysis revealed successful overexpression of Arg-II; (b). Immunoblotting analysis of cellular senescence markerp21 andp53;(c). SA-β-gal staining (***, P < 0.001 vs. Vehicle group; ##, P < 0.01 vs. ox-LDL group; $$$, P < .001 vs. ox-LDL+Nintedanib group).
Data availability statement /Availability of data materials
The data and materials of this study are available upon reasonable request from the corresponding authors.