Figures & data
Figure 1. Germ elevates the proliferation, upregulates CHRM1 expression and activates the Gq/PLCβ/PKC signaling in OA-treated PC12 cells. (a) The chemical structure of Germ. (b) CCK-8 assay appraised the proliferation of PC12 cells after administration of different concentrations of Germ. (c) The impacts of Germ on the proliferation of OA-treated PC12 cells were assessed by CCK-8 assay. (d) Western blot was used to detect the protein levels of CHRM1, Gq, PLCβ and PKC. ***P < 0.001 vs. control; #P < 0.05, ##P < 0.01, ###P < 0.001 vs. OA.
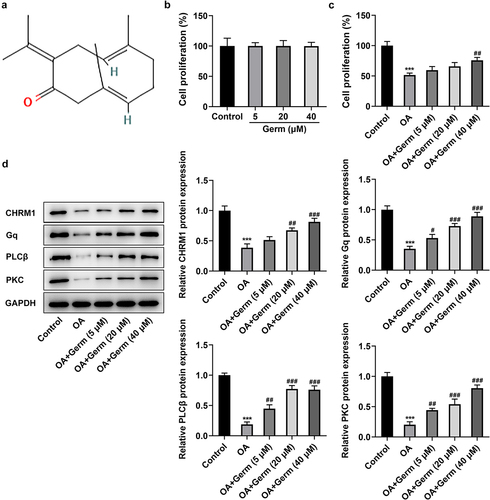
Figure 2. Germ enhances the proliferation and reduces oxidative stress in OA-stimulated PC12 cells through activating CHRM1. (a) RT-qPCR and (b) Western blot was employed to determine the knockdown efficiency of CHRM1. **P < 0.01, ***P < 0.001 vs. sh-NC. (c) CCK-8 assay was used to measure cell proliferation. (d) ROS level was estimated by DCFH-DA assay. (e) SOD, (f) GSH-Px and (g) MDA levels were examined by corresponding kits. ***P < 0.001 vs. control; ###P < 0.001 vs. OA; $P < 0.05, $$P < 0.01, $$$P < 0.001 vs. OA+Germ+sh-NC.
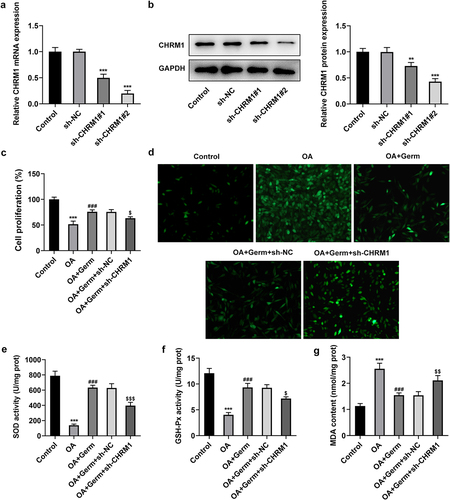
Figure 3. Germ elevates CHRM1 expression to ease OA-elicited injury of PC12 cells. (a) p-tau, (b) Aβ42 and (c) APP levels were detected by ELISA assay. (d) BACE-1 and APOE expression was tested by RT-qPCR. ***P < 0.001 vs. control; ###P < 0.001 vs. OA; $P < 0.05, $$P < 0.01, $$$P < 0.001 vs. OA+Germ+sh-NC.
Figure 4. Germ leads to the activation of Gq/PLCβ/PKC signaling by enhancing CHRM1 expression. Western blot was employed to evaluate the protein levels of Gq, PLCβ and PKC. ***P < 0.001 vs. control; ###P < 0.001 vs. OA; $$P < 0.01 vs. OA+Germ+sh-NC.
Figure 5. The inactivation of Gq/PLCβ/PKC signaling attenuates the impacts of Germ on the proliferation and oxidative stress in OA-stimulated PC12 cells. (a) CCK-8 assay was used to measure cell proliferation. (b) ROS level was estimated by DCFH-DA assay. (c) SOD, (d) GSH-Px and (e) MDA levels were examined by corresponding kits. ***P < 0.001 vs. control; ###P < 0.001 vs. OA; $P < 0.05, $$P < 0.01, $$$P < 0.001 vs. OA+Germ.
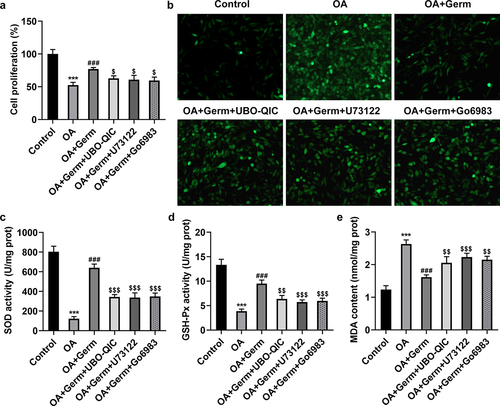
Figure 6. The inactivation of Gq/PLCβ/PKC signaling weakens the function of Germ on OA-elicited injury of PC12 cells. (a) p-tau, (b) Aβ42 and (c) APP levels were detected by ELISA assay. (d) BACE-1 and APOE expression was tested by RT-qPCR. ***P < 0.001 vs. control; ###P < 0.001 vs. OA; $P < 0.05, $$P < 0.01, $$$P < 0.001 vs. OA+Germ.