Figures & data
Figure 1. Baseline assessment of miR-7-5p levels in tissues and cells and construction of overexpression and inhibition models. (a) The database predicted the expression of miR-7 in BCa tissues. (b) The expression of miR-7-5p in 47 BCa tissues and adjacent tissues. (c) The expression of miR-7-5p in the SV-HUC-1, T24T, and EJ cells. (d) MiR-7-5p mimic was applied to T24T and EJ cell lines. (*p < 0.05, ** p < 0.01).
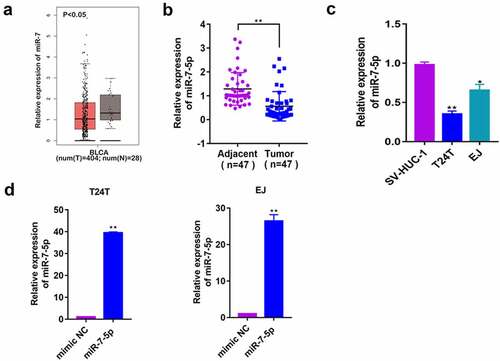
Figure 2. MiR-7-5p suppresses the migration and invasion of BCa cells. (a) Compared with the mimic NC group, the miR-7-5p group showed inhibition of the migration and invasion of BCa cells. (b) Compared with the anti-NC group. The anti-miR-7-5p group showed increased migration and invasion compared with the anti-NC group. (c) The histograms represent the migration and invasion rates of the indicated cells. (d, e) Wound healing assays also verified that miR-7-5p could inhibit the migration of BCa cells. (f) The statistical results of the scratch wound cell migration assay. Red lines represent the scratch area 24 h after the scratch. (*p < 0.05, ** p < 0.01).
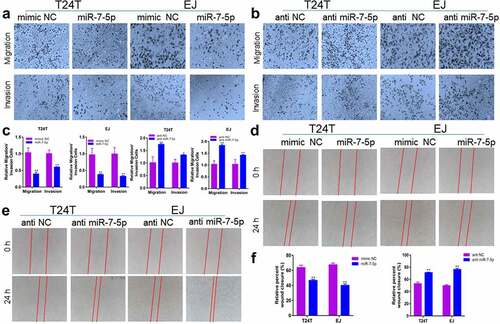
Figure 3. MiR-7-5p inhibits the level of autophagy, and autophagy marker expression changes correspondingly. (a, b) Western blot data reveled that after miR-7-5p mimic treatment of T24T and EJ cell lines, the expression level of the autophagy-related marker Beclin 1 decreased, the expression level of P62 increased, and the ratio of LC3BI to LC3BII decreased. The opposite result was obtained after anti-miR-7-5p treatment. (c, d) The TEM results revealed that the formation of autophagosomes in EJ cells was inhibited by miR-7-5p. The histogram shows a statistical diagram of APLs. The red arrows represent ASS.
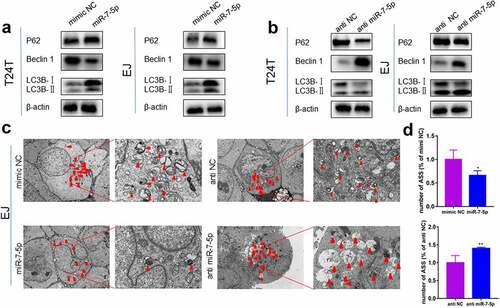
Figure 4. MiR-7-5p mediates autophagy inhibition, migration and invasion. (a, b) Transwell assay results demonstrated that after 24 h of treatment with BBN and Baf A1 in T24T and EJ cell lines, respectively, there were significantly fewer cells passing through the chamber in the Baf A1 treatment group compared to the control group, and the number of cells passing through the chamber increased significantly after BBN treatment. (d, e) In both cell lines, there was an obvious decrease in the number of cells passing through the chamber after miR-7-5p compared to mimic NC treatment, indicating a decrease in cell migration and invasion. However, when BBN was added after miR-7-5p treatment, the number of cells passing through the chamber was increased compared to that with miR-7-5p alone. (c, f) Cell count results from the Transwell invasion assay. The bar chart represents the average of three independent experiments.
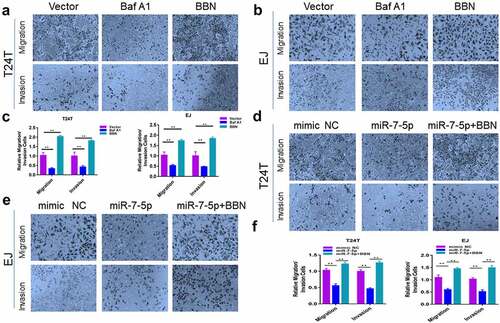
Figure 5. MiR-7-5p targets ATG7 to inhibit autophagy. (a) Western blot experiments showed a significant decrease in ATG7 protein expression after miR-7-5p transfection compared to mimic NC transfection. (b) The PCR results showed no change in mRNA levels at ATG7 after miR-7-5p treatment of T24T and EJ cells for 48 h. (c) MiR-7-5p could bind to the 3’-UTR of ATG7. The red areas are mutated nucleotides. (d) In 293 T cells, the WT or MUT ATG7 3’-UTR luciferase reporter gene was transfected along with miR-7-5p mimic or mimic NC, and the cells were lysed 24 h later to assess the relative luciferase activity. (e) The database predicted that ATG7 was expressed at obviously higher levels in 404 BCa tissues than in 28 adjacent tissues. The expression of ATG7 in bladder urothelial carcinoma (BLCA) based on individual cancer stages. (f) ATG7 immunohistochemical staining of BCa and paracancer tissues. (g) The Western blot experiment data reveled that ATG7 expression was obviously higher in T24T and EJ cells than in SV-HUC-1 cells. (h, i)The expression of ATG7 was increased by instant transfection of plasmids, and the Western blot experiment showed that the expression of miR-7-5p inhibited the occurrence of autophagy, but the miR-7-5p co-expression responded to the occurrence of autophagy.
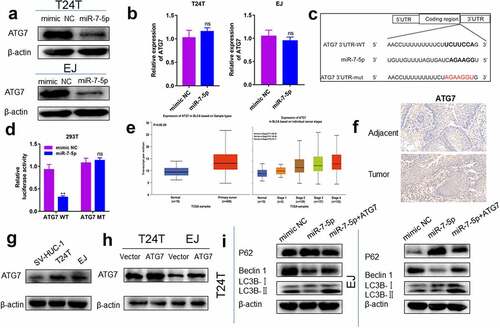
Figure 6. MiR-7-5p increases BCa cell cisplatin sensitivity via ATG7 inhibition. (a) T24T and EJ cells were transfected with mimic NC and miR-7-5p and then cultured with cisplatin at different concentrations for 48 h to detect the cell viability with the CCK-8 assay. (b) T24T and EJ cells were transfected with NC or miR-7-5p mimic and cultured with cisplatin[T24T (4 µM), EJ (5 µM)]; then the cells were treated with or without BBN. The indicated cisplatin concentration before CCK-8 evaluation [T24T (4 µM), EJ (5 µM)]. (c) Other conditions remained unchanged, but BBN was applied to cells with simultaneous expression of miR-7-5p and forced expression of ATG7.
![Figure 6. MiR-7-5p increases BCa cell cisplatin sensitivity via ATG7 inhibition. (a) T24T and EJ cells were transfected with mimic NC and miR-7-5p and then cultured with cisplatin at different concentrations for 48 h to detect the cell viability with the CCK-8 assay. (b) T24T and EJ cells were transfected with NC or miR-7-5p mimic and cultured with cisplatin[T24T (4 µM), EJ (5 µM)]; then the cells were treated with or without BBN. The indicated cisplatin concentration before CCK-8 evaluation [T24T (4 µM), EJ (5 µM)]. (c) Other conditions remained unchanged, but BBN was applied to cells with simultaneous expression of miR-7-5p and forced expression of ATG7.](/cms/asset/c642122d-96a2-485e-bddb-ecd28a0bed9b/kbie_a_2037323_f0006_oc.jpg)
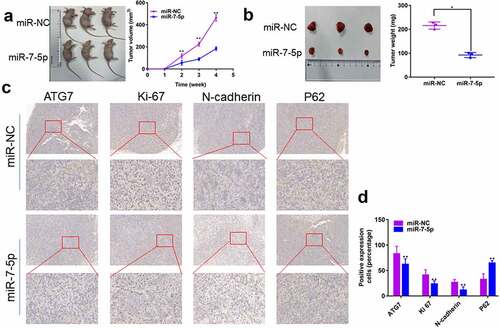
Figure 7. MiR-7-5p inhibits the development of tumors in vivo. (a, b) T24T cells (5 × 10⁶) stably transduced and expressing miR-7-5p or miR-NC were implanted subcutaneously into nude BALB/c mice (four weeks old, female), and tumor size and volume were evaluated weekly. After 28 days, tumors were collected; the tumors were lower in weight and volume in miR-7-5p mimic mice than in mimic NC mice. (c) IHC staining showed that miR-7-5p mimic transfection resulted in decreased expression of ATG7, Ki-67 and N-cadherin and increased expression of P62 in tumors. The data are shown as the mean ± SEM, **P < 0.01 (Student’s t-test).