Figures & data
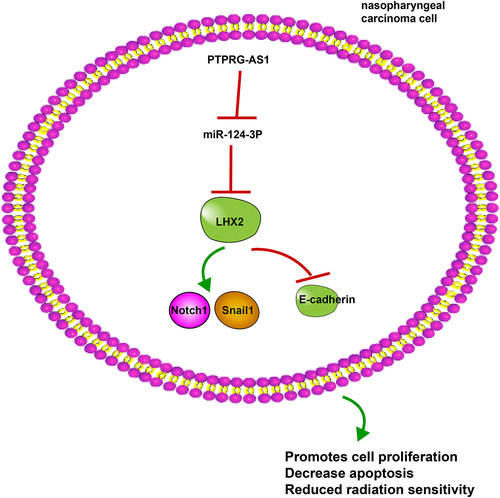
Table 1. Primer sequence
Figure 1. LncRNA PTPRG-AS1 was highly expressed in NPC. (a) Volcano map of differentially expressed genes in NPC-related gene expression microarray GSE64634, with the abscissa representing -log10 (P value), the ordinate representing log2FC, the red dot representing high expression genes, and the green dot representing low expression genes; (b) The heat map of differentially expressed lncRNAs, with the color scale from blue to red indicating that the expression value is from low to high; (c) PTPRG-AS1 was significantly highly expressed in NPC (N = 12) compared with the normal samples (N = 4); (d-e) The expression of PTPRG-AS1 in NPC tissues, paracancerous tissues of 61 NPC patients, and cell lines was detected by RT-qPCR; (f) The radiosensitivity of NPC cell lines was detected by cloning formation assay (stained after 12 d of irradiation with doses of 2–8 Gy, and Linear quadratic model was used to analyze and draw cell dose survival curve). The cell experiments were repeated 3 times, and the data were expressed as mean ± standard deviation. Independent t test was applied for comparisons between two groups in panel D and one-way ANOVA was used for comparisons among multi-groups in panel E and F. Tukey’s multiple comparisons test was used for the post hoc test. ** P < 0.01.
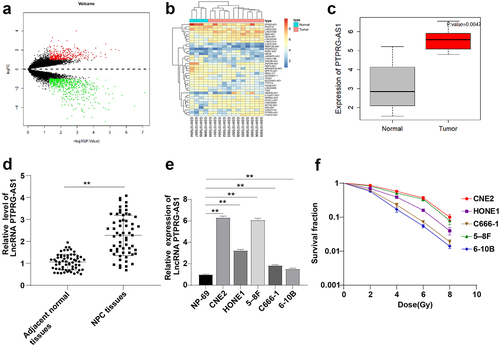
Figure 2. PTPRG-AS1 knockdown promoted radiotherapy-induced apoptosis of NPC cells and enhanced radiosensitivity. PTPRG-AS1 siRNA was transfected into CNE2 and 5–8 F cells to inhibit PTPRG-AS1 expression. (a) The expression of PTPRG-AS1 was detected by RT-qPCR; (b) The radiosensitivity of cells in each group was detected by cloning formation assay (stained after 12 d of irradiation with doses of 2–8 Gy, and Linear quadratic model was used to analyze and draw cell dose survival curve); (c) CCK-8 method was used to measure the proliferation of NPC cells in each group before and after radiotherapy (0/6 Gy); (d) Flow cytometry was used to detect the apoptosis rate of NPC cells in each group before and after radiotherapy (0/6 Gy). The cell experiments were repeated 3 times, and the data were expressed as mean ± standard deviation. One-way ANOVA was used for comparisons among groups. Tukey’s multiple comparisons test was used for the post hoc test. **P < 0.01.
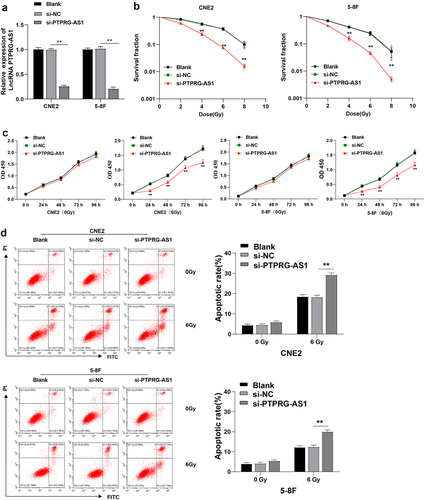
Figure 3. PTPRG-AS1 inhibited miR-124-3p in NPC cells. (a) The downstream miRNAs of PTPRG-AS1 were predicted using the StarBase and LncBase v2.0, and the Venn graph of the intersections was obtained; (b) KEGG enrichment analysis of miRNAs; (c) The binding sites of PTPRG-AS1 and miR-124 were predicted using the StarBase; (d) Dual-luciferase assay and (e) RNA pull-down assay were used to verify the interaction between PTPRG-AS1 and miR-124; (f) The expression of miR-124-3p in NPC tissues and paracancerous tissues was detected by RT-qPCR; (g) The correlation between miR-124-3p and PTPRG-AS1 in NPC tissues of 61 NPC patients was analyzed by Pearson correlation analysis; (h) The expression of miR-124-3p in CNE2/5–8 F cells was assessed by RT-qPCR. The experiments were repeated 3 times, and the data were expressed as mean ± standard deviation. Independent t test was used for comparisons between 2 groups in panel D, and one-way ANOVA was used for comparisons among multi-groups in panels E/H. Tukey’s multiple comparisons test was used for the post hoc test. Independent t test was adopted for comparisons between two groups in panel F. **P < 0.01.
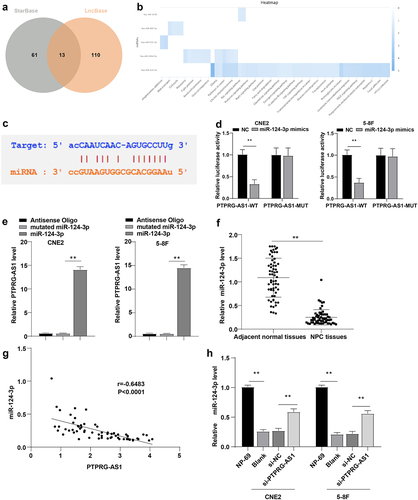
Figure 4. Inhibition of miR-124-3p partially reversed PTPRG-AS1 knockdown-induced radiosensitivity of NPC cells. PTPRG-AS1 was knocked down and miR-124-3p was inhibited in CNE2 and 5–8 F cells. (a) The expression of miR-124-3p was detected by RT-qPCR; (b) The radiosensitivity of cells in each group was detected by cloning formation assay (stained after 12 d of irradiation with doses of 2–8 Gy, and Linear quadratic model was used to analyze and draw cell dose survival curve); (c) CCK-8 method was used to measure the proliferation of NPC cells in each group before and after radiotherapy (0/6 Gy); (d) Flow cytometry was used to detect the apoptosis rate of NPC cells in each group before and after radiotherapy (0/6 Gy). The experiments were repeated 3 times, and the data were expressed as mean ± standard deviation. One-way ANOVA was used for comparisons among groups. Tukey’s multiple comparisons test was used for the post hoc test. *P < 0.05, **P < 0.01.
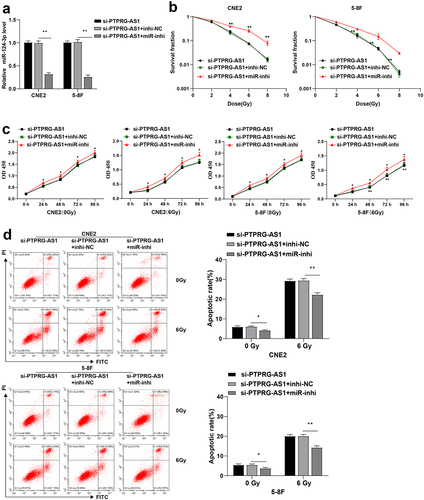
Figure 5. miR-124-3p targeted LHX2. (a) The downstream genes of miR-124-3p were predicted using StarBase, TargetScan and miRDB, and the Venn graph of the intersection with DEGs_up was obtained; (b) The expression of LHX2 in NPC (N = 12) was significantly highly expressed compared with the normal samples (N = 4); (c) The LHX2 level in NPC tissues and paracancerous tissues of 61 NPC patients was detected by WB; (d) The correlation between LHX2 and miR-124-3p in NPC tissues of 61 NPC patients was analyzed by Pearson correlation analysis; (e) The binding sites between miR-124-3p and LHX2 were predicted using the StarBase; (f) Dual-luciferase assay and (g) RNA pull-down assay were used to verify the interaction between miR-124-3p and LHX2; (h) The expression of miR-124-3p was detected using RT-qPCR; (i) The expression of LHX2 in CNE2/5–8 F cells of each group was detected by WB. The experiments were repeated 3 times, and the data were expressed as mean ± standard deviation. Independent t test was used for comparisons between 2 groups in panel C/F, and one-way ANOVA was used for comparisons among multi-groups in panels G/H/I. Tukey’s multiple comparisons test was used for the post hoc test. **P < 0.01.
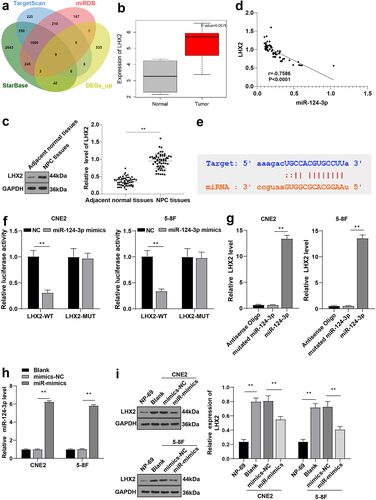
Figure 6. Overexpression of LHX2 attenuated the radiosensitivity of NPC cells induced by overexpression of miR-124-3p. miR-124-3p was overexpressed and LHX2 was overexpressed in CNE2 and 5–8 F cells. (a) The expression of LHX2 was detected by WB; (b) The radiosensitivity of cells in each group was detected by cloning formation assay (stained after 12 d of irradiation with doses of 2–8 Gy, and Linear quadratic model was used to analyze and draw cell dose survival curve); (c) CCK-8 method was used to measure the proliferation of NPC cells in each group before and after radiotherapy (0/6 Gy); (d) Flow cytometry was used to detect the apoptosis rate of NPC cells in each group before and after radiotherapy (0/6 Gy). The experiments were repeated 3 times, and the data were expressed as mean ± standard deviation. One-way ANOVA was used for comparisons among groups. Tukey’s multiple comparisons test was used for the post hoc test. In panels A/E, *P < 0.05, **P < 0.01. In panels C/D, *compared with the blank group, P < 0.01, #compared with the blank group, P < 0.05, ##compared with the blank group, P < 0.01.
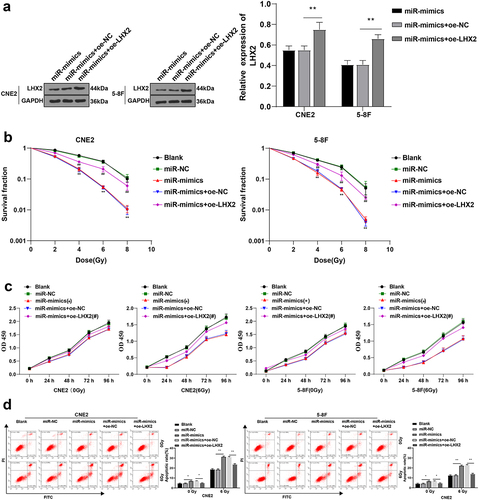
Figure 7. LHX2 attenuated radiosensitivity of NPC cells through activating the Notch pathway. (a) The expressions of the Notch pathway-related proteins Notch1, Snail1 and E-cadherin were detected by WB; Then, the Notch pathway inhibitor was added and (b) the expressions of the Notch pathway-related proteins Notch1, Snail1 and E-cadherin were detected by WB; (c) The radiosensitivity of cells in each group was detected by cloning formation assay (stained after 12 d of irradiation with doses of 2–8 Gy, and Linear quadratic model was used to analyze and draw cell dose survival curve). The experiments were repeated 3 times, and the data were expressed as mean ± standard deviation. One-way ANOVA was used for comparisons among groups. Tukey’s multiple comparisons test was used for the post hoc test. **P < 0.01.
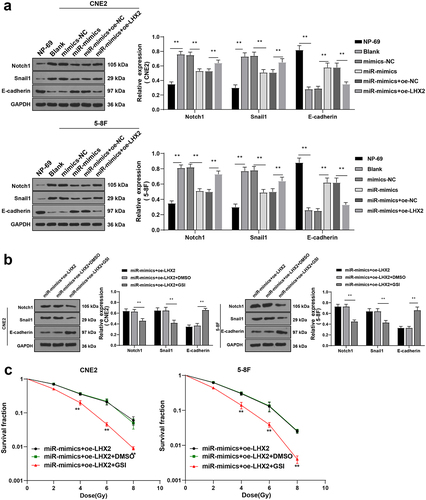
Figure 8. PTPRG-AS1 activated the Notch pathway in NPC cells. PTPRG-AS1 was knocked down in CNE2 and 5–8 F cells and the levels of the Notch pathway-related proteins Notch1, Snail1, and E-cadherin were assessed by WB. The experiments were repeated 3 times, and the data were expressed as mean ± standard deviation. One-way ANOVA was used for comparisons among groups. Tukey’s multiple comparisons test was used for the post hoc test. **P < 0.01.