Figures & data
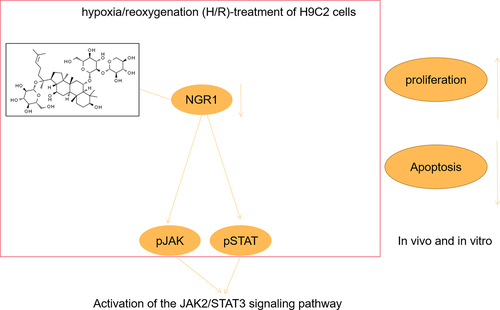
Figure 1. NGR1 promoted the viability and proliferation of the H/R treated H9C2 cells a Molecular structure formula of NGR1. b CCK-8 assay was conducted to detect the cell viability. c EdU assay was performed to measure the proliferation ability of the cells. ###P < 0.001, VS CON group. *P < 0.05, **P < 0.01, ***P < 0.001, VS H/R group.
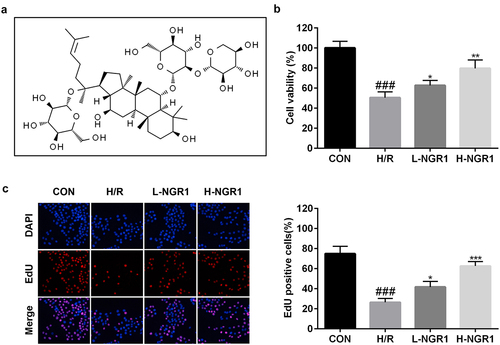
Figure 2. NGR1 inhibited the apoptosis rate of the H/R treated H9C2 cells a-b The apoptosis rate of the cells was measured with Flow cytometry and TUNEL staining. c Western blot was performed to determine the protein expression of Caspase3, Bax and Bcl-2. ##P < 0.01, ###P < 0.001 VS CON group. *P < 0.05, **P < 0.01, VS H/R group.
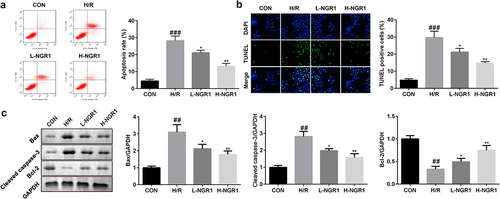
Figure 3. NGR1 activated the JAK2/STAT3 signaling pathway The protein expression of p-JAK2 and p-STAT3 was analyzed by Western blot. ###P < 0.001, VS CON group. *P < 0.05, **P < 0.01, ***P < 0.001, VS H/R group.
Figure 4. AG490 inhibited the JAK2/STAT3 signaling pathway a The protein expression of p-JAK2 and p-STAT3 was analyzed by Western blot. ###P < 0.001, VS CON group. **P < 0.01, ***P < 0.001 VS H/R group. &P < 0.05, &&P < 0.01 VS NGR1 group.
Figure 5. AG490 reversed the effects of NGR1 a CCK-8 assay was conducted to detect the cell viability. b EdU assay was performed to measure the proliferation ability of the cells. c-d The apoptosis rate of the cells was measured with Flow cytometry and TUNEL staining. e Western blot was performed to determine the protein expression of Caspase3, Bax and Bcl-2. ##P < 0.01, ###P < 0.001, VS CON group. **P < 0.01 VS H/R group. &P < 0.05, &&P < 0.01 VS NGR1 group.
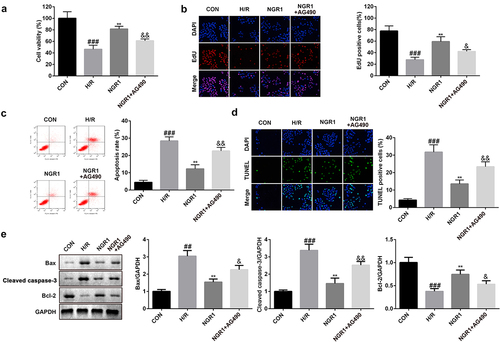
Figure 6. NGR1 relieved the MI in vivo a The myocardial infarction area was tested by TTC staining. b The apoptosis rate of the cells was measured with TUNEL staining. c Western blot was performed to determine the protein expression of Caspase3, Bax and Bcl-2. d ELISA was performed to determine the expressions of BNP and NT-proBNP. ##P < 0.01 VS Sham group. *P < 0.05, **P < 0.01, VS Model group.
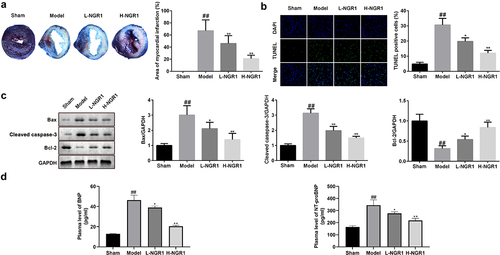
Figure 7. NGR1 activated the JAK2/STAT3 signaling pathway in vivo a The protein expression of p-JAK2 and p-STAT3 was analyzed by Western blot. ##P < 0.01 VS Sham group. **P < 0.01 VS Model group.