Figures & data
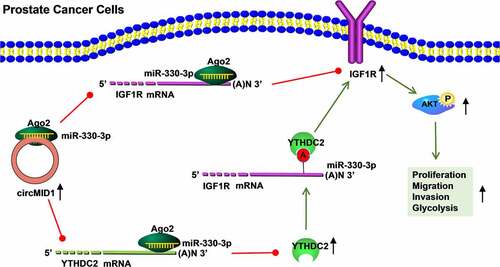
Table 1. Correlation of circMID1 expression and the clinicopathologic features in patients with PCa
Table 2. Primer sequences used for qRT-PCR
Figure 1. CircMID1 was upregulated in PCa tissues and cells. (a) Volcanic map showed the differentially expressed circRNAs in H-PCa tissues and L-PCa tissues screened from GSE113153 database. (b) Heat map showed the TOP10 circRNA with the most obvious up-regulated and down-regulated expressions in H-PCa tissues and L-PCa tissues. (c) The expression of circMID1, circHMGCS1 and circRAB3IP in RWPE-1, PC-3 and DU145 cells was measured by qRT-PCR. (d) CircMID1 expression in L-PCa tissues, H-PCa tissues and the prostatectomy tissues of BPH patients was detected by qRT-PCR. (e) The basic information of circMID1 was shown. (f) After the cDNA and gDNA of circMID1 were amplified by divergent primers and convergent primers, the PCR products were used in agarose gel electrophoresis analysis. (g-h) Subcellular localization assay was used to confirm the distribution of circMID1 in cytoplasm and nucleus of PC-3 and DU145 cells. (i) The transfection efficiency of sh-circMID1 was confirmed by detecting circMID1 expression using qRT-PCR. *P < 0.05, **P < 0.01, ***P < 0.001.
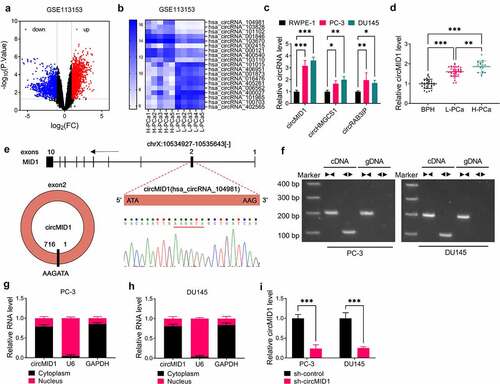
Figure 2. Downregulation of circMID1 inhibited the proliferation, migration, invasion and glycolysis of PCa cells. PC-3 and DU145 cells were transfected with sh-control or sh-circMID1. EdU staining (a), colony formation assay (b) and flow cytometry (c-d) were used to assess cell proliferation. Wound healing assay (e) and transwell assay (f) were performed to measure cell migration and invasion. Glucose uptake (g), lactate product (h) and ECAR (i-j) were determined to evaluate cell glycolysis. (k-l) The protein levels of IGF1R, p-AKT/AKT, cyclin D1 and GLUT1 were evaluated using WB analysis. **P < 0.01, ***P < 0.001.
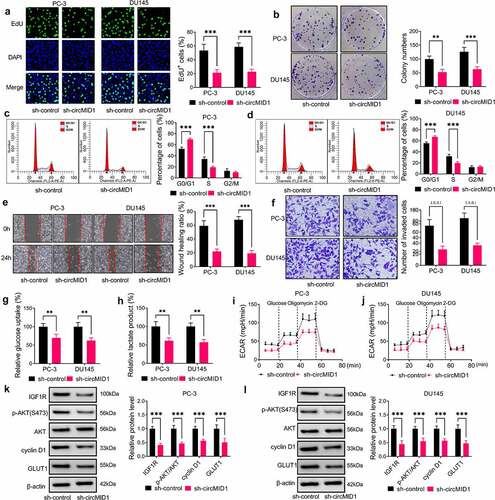
Figure 3. CircMID1 positively regulated IGF1R expression via YTHDC2. (a-b) The expression of YTHDC2 and IGF1R in L-PCa tissues, H-PCa tissues and the prostatectomy tissues of BPH patients was measured by qRT-PCR. (c) The protein expression of YTHDC2 and IGF1R in L-PCa tissues, H-PCa tissues and the prostatectomy tissues of BPH patients was determined using WB analysis. Three lanes represent three different tissue samples. (d) Pearson correlation analysis was used to assess the correlation between YTHDC2 and IGF1R in PCa tissues. (e) WB analysis was used to detect the protein expression of YTHDC2 and IGF1R in RWPE-1, PC-3 and DU145 cells. (f) RIP assay was used to confirm the interaction between YTHDC2 and IGF1R. (g) After transfected with sh-control or sh-YTHDC2 into PC-3 and DU145 cells, the protein expression of IGF1R was measured by WB analysis. (h-i) ActD assay was performed to evaluate the effect of sh-YTHDC2 on the stability of IGF1R. (j) WB analysis was used to measure IGF1R protein expression in PC-3 and DU145 cells transfected with sh-control or sh-circMID1. (k-l) Pearson correlation analysis was used to evaluate the correlation between circMID1 and YTHDC2 or IGF1R in PCa tissues. *P < 0.05, **P < 0.01, ***P < 0.001.
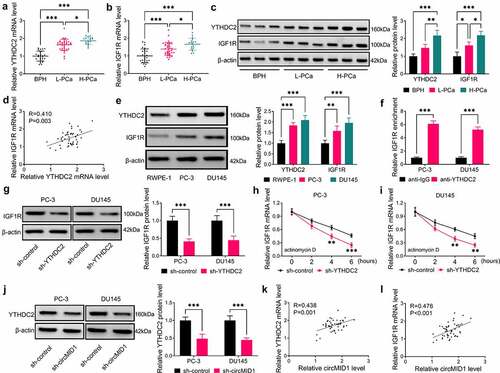
Figure 4. Overexpression of YTHDC2 and IGF1R reversed the effects of circMID1 knockdown on PCa progression. PC-3 and DU145 cells were transfected with sh-control + pcDNA, sh-circMID1 + pcDNA, sh-circMID1 + YTHDC2 or sh-circMID1 + IGF1R. Cell proliferation was determined using EdU staining (a), colony formation assay (b) and flow cytometry (c-d). Cell migration and invasion were measured by wound healing assay (e) and transwell assay (f). Cell glycolysis was evaluated by detecting glucose uptake (g), lactate product (h) and ECAR (i-j). (k-l) WB analysis was performed to test the protein levels of IGF1R, p-AKT/AKT, cyclin D1 and GLUT1. *P < 0.05, **P < 0.01, ***P < 0.001.
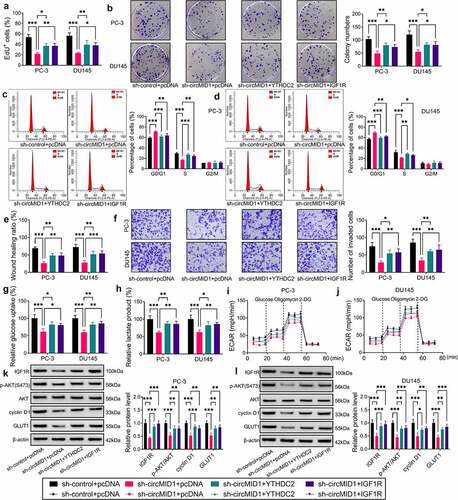
Figure 5. CircMID1 interacted with miR-330-3p to modulate YTHDC2/IGF1R axis. (a-b) RIP assay was used to confirm that circMID1 could combine with Ago2. (c) Venn diagram showed the targeted miRNAs that could interact with circMID1, YTHDC2 and IGF1R. (d-e) RNA pull-down assay was used to confirm the interaction between circMID1 and candidate miRNAs. (f) The binding sites and mutate sites between miR-330-3p and circMID1, YTHDC2 or IGF1R were exhibited. Dual-luciferase reporter assay (g-j) and RNA pull-down assay (k-l) were used to confirm the interaction between miR-330-3p and circMID1, YTHDC2 or IGF1R. (m-o) The protein levels of YTHDC2 and IGF1R were measured by WB analysis in PC-3 and DU145 cells transfected with sh-control + anti-NC, sh-circMID1 + anti-NC, or sh-circMID1 + anti-miR-330-3p. *P < 0.05, **P < 0.01, ***P < 0.001.
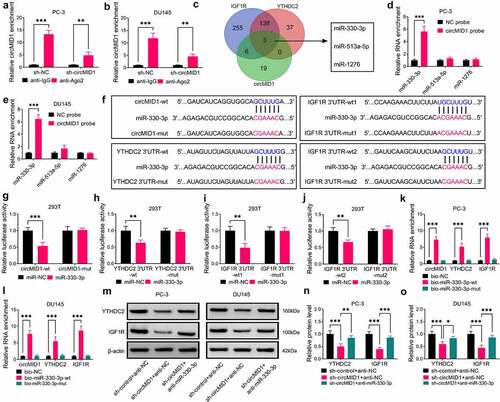
Figure 6. CircMID1 promoted PCa progression via regulating the miR-330-3p/YTHDC2/IGF1R axis. PC-3 and DU145 cells were transfected with sh-control + anti-NC + pcDNA, sh-circMID1 + anti-NC + pcDNA, sh-circMID1 + anti-miR-330-3p + pcDNA or sh-circMID1 + anti-miR-330-3p + YTHDC2. EdU staining (a), colony formation assay (b) and flow cytometry (c-d) were performed to detect cell proliferation. Cell migration and invasion were determined using wound healing assay (e) and transwell assay (f). Glucose uptake (g), lactate product (h) and ECAR (i-j) were measured to assess cell glycolysis. (k-l) The protein levels of IGF1R, p-AKT/AKT, cyclin D1 and GLUT1 were examined by WB analysis. *P < 0.05, **P < 0.01, ***P < 0.001.
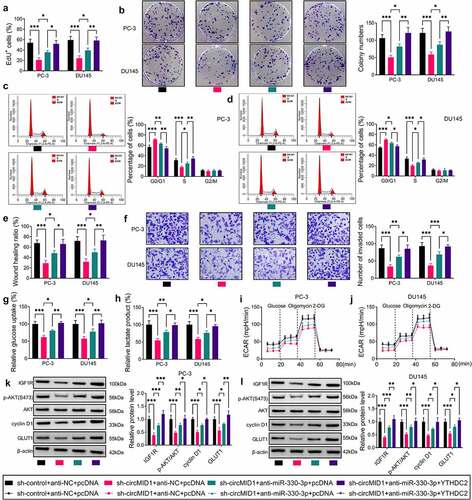
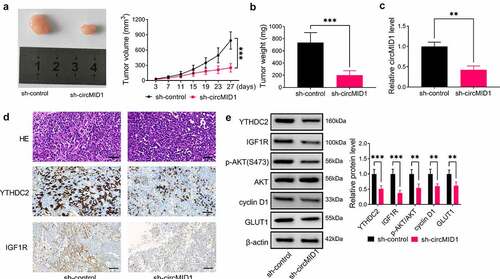
Figure 7. CircMID1 interference inhibited PCa tumor growth in vivo. PC-3 cells transfected with sh-control or sh-circMID1 were injected into nude mice. (a) Tumor volume was measured every 4 days starting from day 3. (b) Tumor weight in each group was detected after 27 days. (c) The circMID1 level in the tumor tissues of each group was tested by qRT-PCR. (d) H&E staining results and IHC staining results were shown in the tumor tissues of each group. (e) WB analysis was used to determine the protein levels of YTHDC2, IGF1R, p-AKT/AKT, cyclin D1 and GLUT1 in the tumor tissues of each group. **P < 0.01, ***P < 0.001.