Figures & data
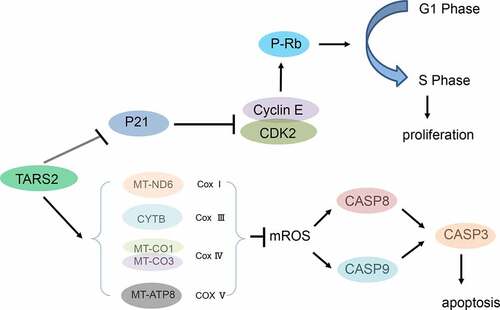
Table 1. Correlation between the clinicopathological characteristics and expression of TARS2 in LUAD
Figure 1. TARS2 is upregulated in LUAD tissues and associated with a poorer prognosis. (a) TARS2 mRNA levels were significantly increased in LUAD (TCGA dataset). CPTAC dataset analysis revealed that TARS2 protein levels were significantly increased in LUAD. (b) TARS2 expression in LUAD tissues, as detected by immunohistochemical staining to verify TARS2 expression in (a – b) LUAD tissue and paired (c – d) nontumor tissue; a – b, positive TARS2 staining in LUAD tissue; c – d, negative TARS2 staining in nontumor tissue. The scale bar represents 100 μm. (c) TARS2 expression in LUAD tissues was detected by Western blotting. (d) The Kaplan-Meier plotter database predicted the OS rates of LUAD patients with TARS2 expression.
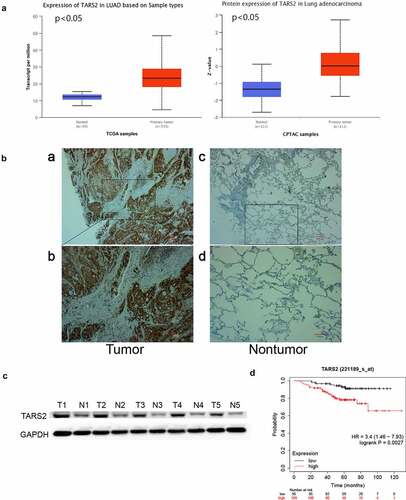
Figure 2. Knockdown of TARS2 inhibits the proliferation of LUAD cells. (a) TARS2 shRNA lentivirus decreased TARS2 expression. GAPDH is utilized as a reference protein. (b) TARS2 knockdown significantly inhibited the growth of LUAD cells, as evaluated by MTS. (c) In colony formation assays, TARS2 knockdown notably reduced the colony numbers of LUAD cells. (d) TARS2 knockdown notably reduces the ratio of EdU-positive LUAD cells (the scale bar represents 100 μm).
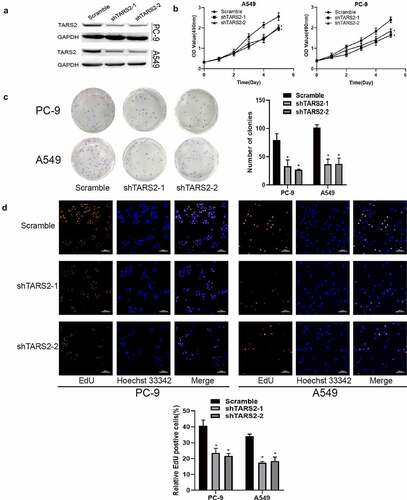
Figure 3. TARS2 knockdown inhibits cell cycle progression (a) Downregulation of TARS2 inhibits the transition from G1 phase to S phase, as evidenced by a flow cytometric assay. (b) The protein levels of p-RB (ser807/811), CDK2, cyclin E1 and cyclin E2 were decreased and that of p21 waf1/cip1 was increased in TARS2-shRNA transfected LUAD cells. GAPDH is utilized as a reference protein.
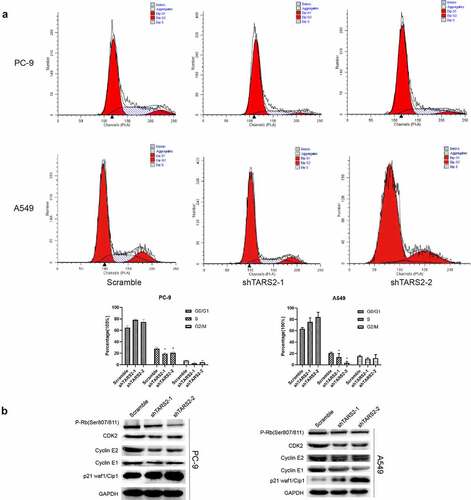
Figure 4. TARS2 knockdown and increases mROS-induced apoptosis of LUAD cells. (a) Downregulation of TARS2 increased production of mROS in PC-9 and A549. (b) The expression of MT-ND6, CYTB, MT-CO1, MT-CO3 and MT-ATP8 were decreased in TARS2-shRNA transfected LUAD cells. TOM20 is utilized as a reference protein. (*P < 0.05). (c) Downregulation of TARS2 decreases mitochondrial membrane potential in A549 and PC-9. (d) Downregulation of TARS2 increases PC-9 and A549 cells apoptosis. (e) The protein levels of cleaved caspase-8, −9 and −3 were decreased in TARS2-shRNA transfected LUAD cells. GAPDH is utilized as a reference protein. (*P < 0.05).
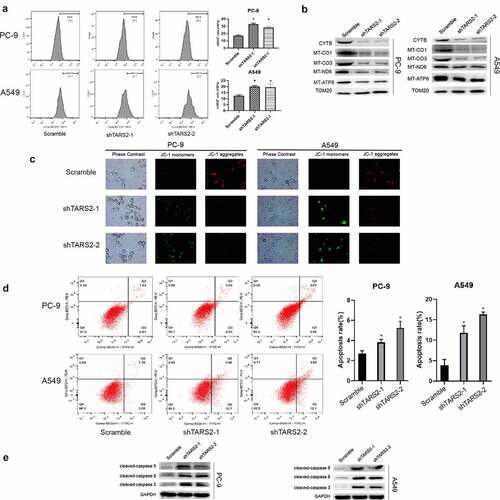
Figure 5. Inhibition of mROS production by melatonin protects MMP and reduces apoptosis. (a) Melatonin decreases mROS production induced by TARS2 knockdown. (b) Melatonin protects MMP induced by TARS2 knockdown. (c) Melatonin protects LUAD from apoptosis induced by TARS2 knockdown. (*P < 0.05).
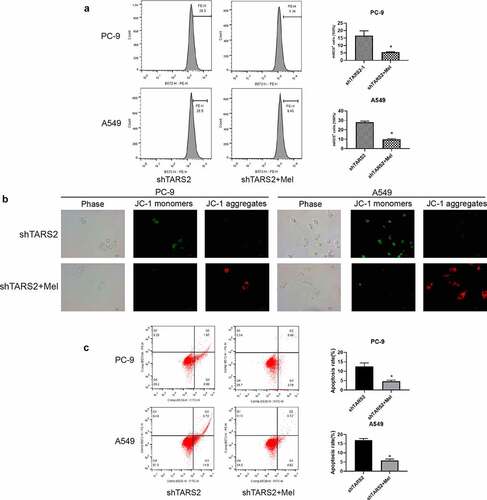
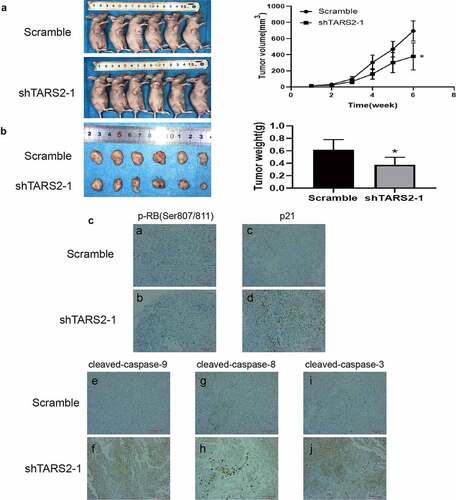
Figure 6. Knockdown of TARS2 inhibits LUAD cells growth in vivo. (a) Tumor growth curves of mice inoculated with A549 cells infected with TARS2 lentivirus were measured weekly with vernier calipers. (b) Tumor weights at 6 weeks post injection. (c)Protein expression in tumor tissue sections detected by immunohistochemical staining. a – b, p-RB(Ser807/811) expression was decreased in shTARS2-1 group compared with SCRAMBLE group; c – d p21 expression was increased in shTARS2-1 group compared with SCRAMBLE group; e-f, cleaved-caspase 9 expression was increased in shTARS2-1 group compare with SCRAMBLE group; g-h, cleaved-caspase 8 expression was increased in shTARS2-1 group compare with SCRAMBLE group; i-j, cleaved-caspase 3 expression was increased in shTARS2-1 group compare with SCRAMBLE group. The scale bar represents 200 μm.