Figures & data
Figure 1. miR-15a-5p is downregulated in WT. A. RT-qPCR tested miR-15a-5p expression in WT tissues and normal tissues; B. RT-qPCR tested miR-15a-5p expression in normal renal tubular epithelial HK-2 cell line and human WT G-401 cells; C. Microscopic observation of hUC-MSCs, and staining of adipocytes and osteoblasts; D. Flow cytometry tested hUC-MSCs surface markers; E. TEM observation of hUC-MSCs-Exo; F. NTA detection of hUC-MSCs-Exo; G. Western blot tested HSP70, CD81, CD9 and GRP94 in hUC-MSCs-Exo; H. Internalization of PKH26-labeled exosomes (red) in G-401 cells; I. RT-qPCR tested miR-15a-5p expression in hUC-MSCs-Exo. Measurement data were shown by the mean ± standard deviation.
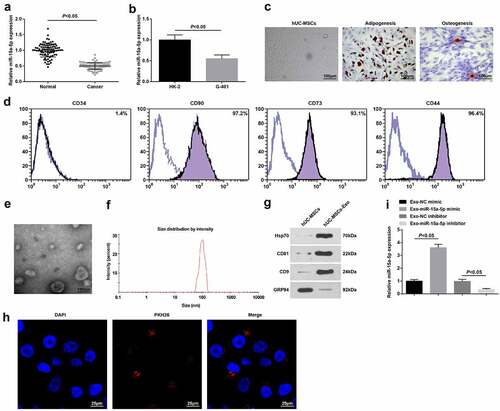
Figure 2. MSC-Exo impair the biological functions of G-401 cells. A. RT-qPCR tested miR-15a-5p in G-401 cells after co-culture with hUC-MSCs-EV; B. CCK-8 tested G-401 cell proliferation; C. Colony formation assay tested G-401 cell colony formation ability; D. Transwell assay tested G-401 cell migration; E. Transwell assay tested G-401 cell invasion; F. Flow cytometry tested G-401 cell apoptosis. Measurement data were shown by the mean ± standard deviation, * P < 0.05 vs the PBS group.
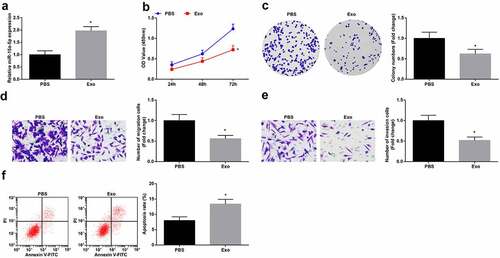
Figure 3. MSC-Exo carrying miR-15a-5p lessen the tumorigenic properties of G-401 cells. A. RT-qPCR tested miR-15a-5p in G-401 cells after co-culture with hUC-MSCs-Exo; B. CCK-8 tested G-401 cell proliferation; C. Colony formation assay tested G-401 cell colony formation ability; D. Transwell assay tested G-401 cell migration; E. Transwell assay tested G-401 cell invasion; F. Flow cytometry tested G-401 cell apoptosis. Measurement data were shown by the mean ± standard deviation, * P < 0.05 vs the Exo-NC mimic group; # P < 0.05 vs the Exo-NC inhibitor group.
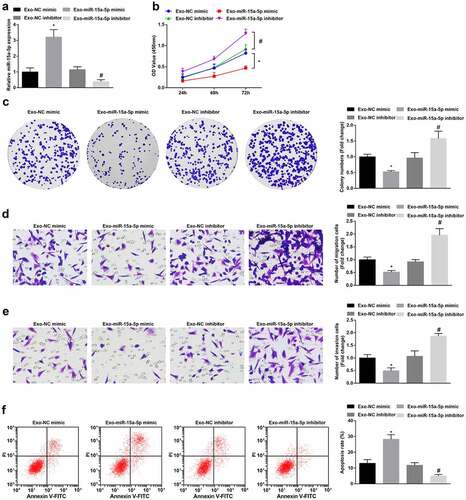
Figure 4. miR-15a-5p targets SEPT2. A-B. RT-qPCR and Western blot tested SEPT2 expression in tissues and cells; C. Targeting site between miR-15a-5p and SEPT2; D. Dual luciferase reporter gene assay tested the targeting of miR-15a-5p and SEPT2; E. Western blot tested SEPT2 expression in G-401 cells after co-culture with hUC-MSCs-Exo; F. Pearson analyzed the correlation between miR-15a-5p and SEPT2. Measurement data were shown by the mean ± standard deviation, # P < 0.05 vs the PBS group; * P < 0.05 vs the Exo-NC mimic group; $ P < 0.05 vs the Exo-NC inhibitor group.
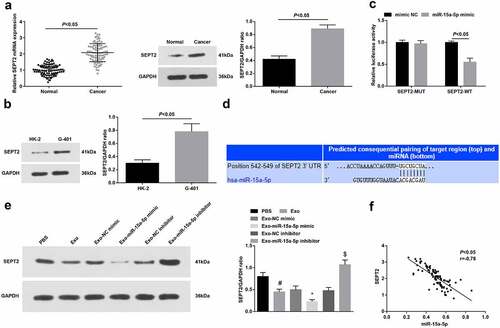
Figure 5. Inhibition of SEPT2 represses the biological function of WT cells. A. Western blot tested SEPT2 expression in G-401 cells transfected with sh-SEPT2; B. CCK-8 tested G-401 cell proliferation; C. Colony formation assay tested G-401 cell colony formation ability; D. Transwell assay tested G-401 cell migration; E. Transwell assay tested G-401 cell invasion; F. Flow cytometry tested G-401 cell apoptosis. Measurement data were shown by the mean ± standard deviation, * P < 0.05 vs the sh-NC group.
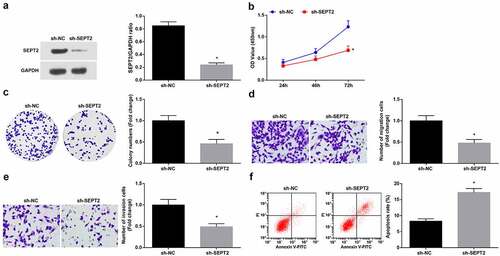
Figure 6. Upregulated SEPT2 reverses hUC-MSCs-Exo-mediated inhibition on G-401 cell growth. A. Western blot tested SEPT2 expression after co-culture of G-401 cells with hUC-MSCs-Exo; B. CCK-8 tested G-401 cell proliferation; C. Colony formation assay tested G-401 cell colony formation ability; D. Transwell assay tested G-401 cell migration; E. Transwell assay tested G-401 cell invasion; F. Flow cytometry tested G-401 cell apoptosis. Measurement data were shown by the mean ± standard deviation, * P < 0.05 vs the Exo+oe-NC group.
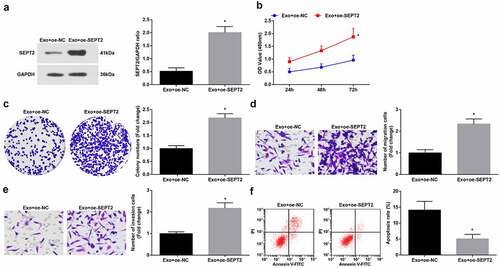
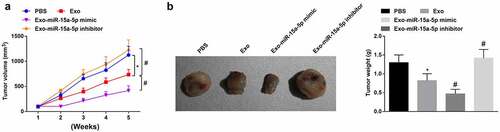
Figure 7. MSC-EV carrying miR-15a-5p weakens tumorigenicity of G-401 cells in vivo. A. Tumor volume change in nude mice; B. Tumors and tumor weight. Measurement data were shown by the mean ± standard deviation, * P < 0.05 vs the PBS group; # P < 0.05 vs the Exo group.