Figures & data

Figure 1. KCNQ1OT1 is significantly down-regulated in SpA-treated hBMSCs. (a) Expression of KCNQ1OT1 in serum samples from OM patients and healthy controls. (b) Expressions of TNF-α and IL-1β in serum samples from OM patients and healthy controls were examined by ELISA assay. (c) ALP activity in hBMSCs treated with different concentrations of SpA after osteogenic differentiation. Scale bar represents 200 μm. (d) Expression levels of osteogenic marker genes in SpA-treated hBMSCs was detected by RT-qPCR and Western blot. (e) Alizarin red S staining in hBMSCs after osteogenic differentiation under different concentrations of SpA. Scale bar represents 100 μm. (f) Expressions of TNF-α and IL-1β in SpA-treated hBMSCs after osteogenic differentiation. (g) KCNQ1OT1 level in hBMSCs treated with different concentrations of SpA after osteogenic differentiation. SpA, staphylococcus aureus; hBMSCs, human bone mesenchymal stem cells; OM, osteomyelitis. *p < 0.05; **p < 0.01; ***p < 0.001.
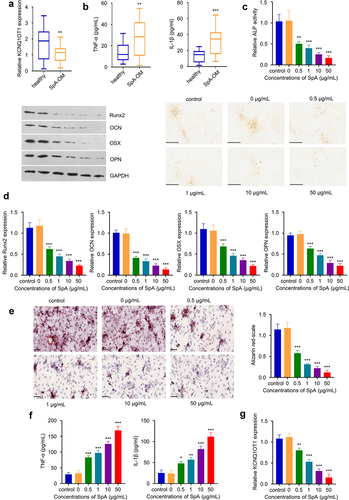
Figure 2. Overexpression of KCNQ1OT1 supports osteogenic differentiation in SpA-infected hBMSCs. (a) Expression of KCNQ1OT1 after transfection with ad-KCNQ1OT1. (b) ALP activity in SpA-treated HBMSCs after overexpressing KCNQ1OT1. (c) Alizarin red S staining in KCNQ1OT1-overexpressing hBMSCs under the treatment of SpA. (d-e) Levels of osteogenesis-related gene markers in different groups were measured by RT-qPCR (d) and Western blot assay (e). (f) Expressions of TNF-α and IL-1β in different groups was analyzed by RT-qPCR. * p < 0.05; **p < 0.01; ***p < 0.001.
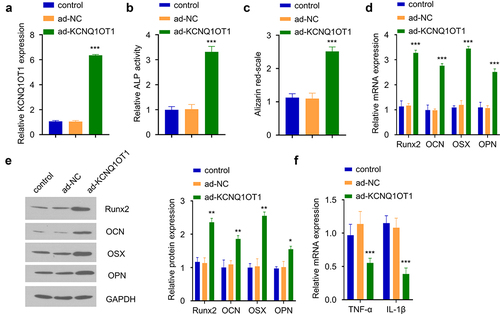
Figure 3. Silencing of miR-29b-3p improves osteogenic differentiation in SpA-infected hBMSCs. (a) Expression of miR-29b-3p in serum samples from OM patients and healthy controls. (b) Correlation between KCNQ1OT1 and miR-29b-3p expression level in the serum samples of OM patients. (c) Expressions of miR-29b-3p in SpA-treated hBMSCs was analyzed by RT-qPCR. (d) The expression of miR-29b-3p was analyzed after transfection with miR-29b-3p inhibitor or mimic. (e) ALP activity assay in SpA-treated hBMSCs after the transfection with miR-29b-3p inhibitor. (f) Alizarin red S staining in SpA-treated hBMSCs after the transfection with miR-29b-3p inhibitor. (d-e) Expression of osteogenic markers in SpA-treated hBMSCs after the transfection with miR-29b-3p inhibitor were examined by RT-qPCR (g) and Western blot (h). (i) Expression of TNF-α and IL-1β in SpA-treated hBMSCs after the transfection with miR-29b-3p inhibitor. *p < 0.05; **p < 0.01; ***p < 0.001.
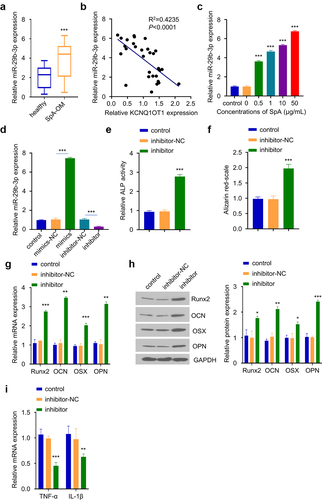
Figure 4. KCNQ1OT1 interacts with miR-29b-3p. (a) The potential binding sequence between KCNQ1OT and miR-29b-3p was predicted by Starbase database. (b) Dual-luciferase reporter assay using WT and MUT reporter in the presence of miR-29b-3p mimic or miR-NC. (c) RNA pull-down assay using biotin-labeled miR-NC or miR-29b-3p. (d) miR-29b-3p expression after KCNQ1OT1 overexpression. (e) miR-29b-3p expression level after co-transfection with ad-KCNQ1OT and miR-29b-3 mimic. * p < 0.05; **p < 0.01; ***p < 0.001.
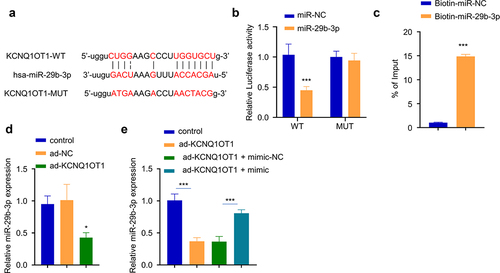
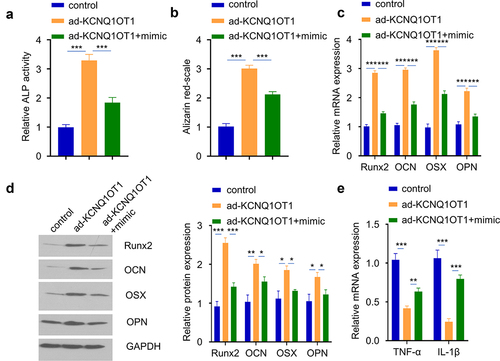
Figure 5. miR-29b-3p mediates the effect of KCNQ1OT1. hBMSCs were transfected with ad-KCNQ1OT1, or ad-KCNQ1OT1+ miR-29b-3 mimic. (a) ALP activity was measured in SpA-treated hBMSCs in different groups. (b) Alizarin red S staining in SpA-treated hBMSCs of different groups. (c-d) Expressions of osteogenic markers in different groups were examined by RT-qPCR (c) and Western blot assay (d). (e) TNF-α and IL-1β levels were analyzed by RT-qPCR in different groups. * p < 0.05; **p < 0.01; ***p < 0.001.