Figures & data
Table 1. The primers used in this study
Figure 1. Histologic changes in mouse lung tissue. The histologic changes in control mice (a) and SII mice (b) were examined using HE-staining.
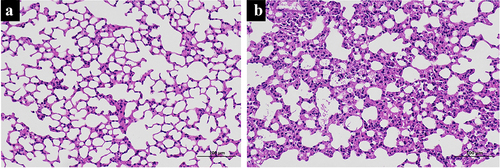
Figure 2. The protein expression levels of TNF-α, IL-1β, Bcl-2, Bax, caspase-7 and caspase-3 in mouse lung as assessed using Western blot analysis. *P < 0.05 compared with control.
Table 2. The detailed information of the top ten up-regulated and top ten down-regulated lncRNAs
Figure 3. Hierarchical clustering of lncRNAs (a) and mRNAs (b) differentially expressed in the lung of smoke inhalation injury mice versus control mice. Heat maps showing significantly (absolute fold-change ≥ 2.0, P ≤ 0.05) regulated lncRNAs (a) and mRNAs (b). Three mice were analyzed in each group. Expression values are presented with the intensity of the color scheme, which ranges from blue to red, indicating low to high relative expression, respectively.
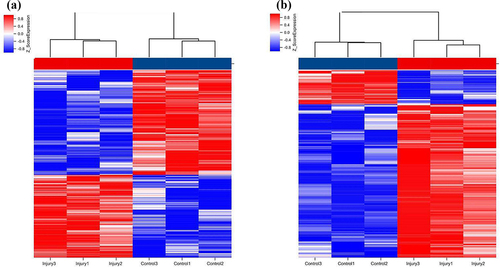
Table 3. The detailed information of the top ten up-regulated and top ten down-regulated mRNAs
Figure 4. Biological functions of differentially expressed mRNAs. The top 10 enriched GO categories involved in molecular function, cellular component, and biological processes.
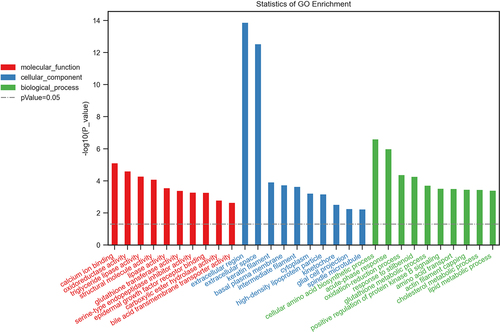
Figure 5. Pathway analysis for differentially expressed mRNAs. The top 30 most enriched pathways based on the KEGG pathway analysis.
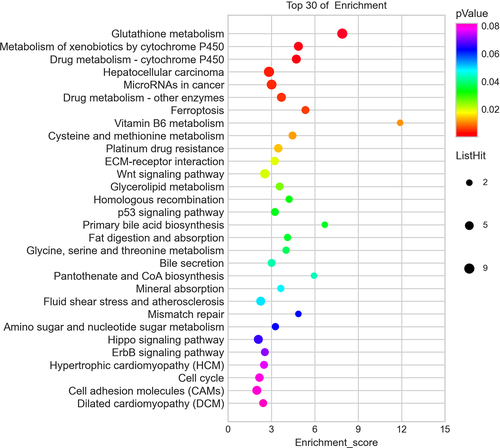
Figure 6. LncRNA-miRNA-mRNA ceRNA network in smoke inhalation injury mouse. The diamond, rectangle, and triangle represent differentially expressed lncRNAs, miRNAs, and mRNAs, respectively.
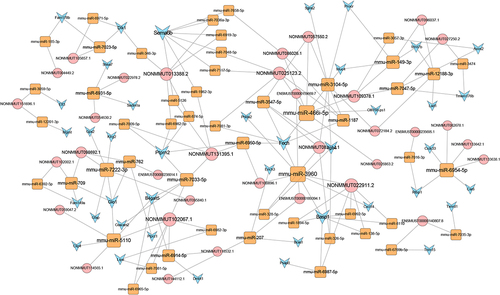
Figure 7. Relative expression levels of NONMMUT026843.2, NONMMUT065071.2, ENSMUST00000235858.1, NONMMUT131395.1, NONMMUT122516.1, NONMMUT057916.2, and NONMMUT013388.2 in the lung. The candidate LncRNAs were verified using RT-qPCR. *P < 0.05 versus control.