
Figures & data

Table 1. Summary of research participants
Figure 1. The Base peak chromatogram from Brucella cases (green) and normal controls (red) in the positive (a) and negative (b) datasets.
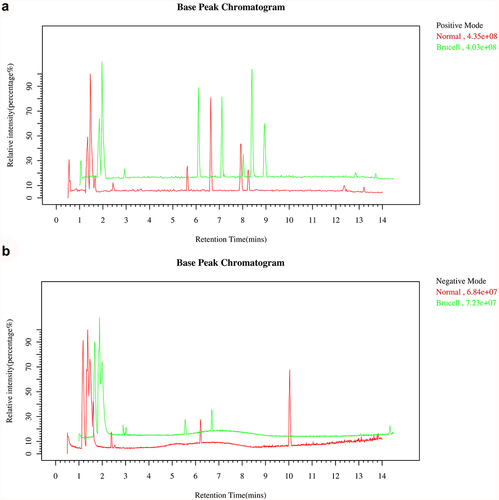
Figure 2. The score scatter plots of ESI+ mode (a) and ESI− mode (b) in Principal Component Analysis (PCA) model; green square indicated Brucella cases, and red circles indicated normal group. Axes showed the percentage of variance of the first two components (PC1, PC2).
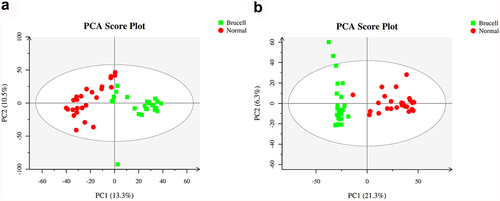
Figure 3. Score plots of partial least squares discriminant analysis (PLS-DA) in CSF samples of normal controls (red circles) and Brucella cases (green square) in the positive (a) and negative (b) datasets; Score scatter plots of positive (c) and negative (d) datasets in OPLS-DA model; green square indicated Brucella cases, while red circles indicated normal group. Axes represented orthogonal component and predictive component of the models.
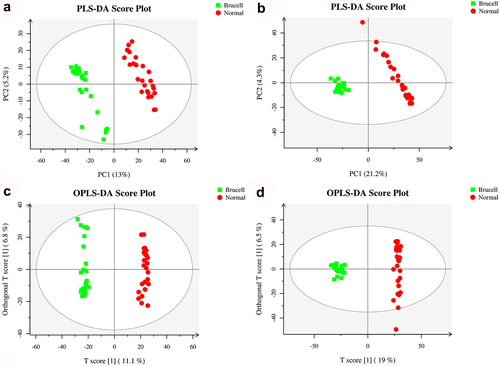
Table 2. Applying orthogonal principal component analysis model, differentiated metabolites were discovered between normal and Brucella cases
Figure 4. Potential biomarkers were detected using LC-MC approach in CSF samples. The figures normalized to total peak area of each metabolite were presented as mean + SD. *p < 0.05, **p < 0.01, ***p < 0.001 in comparison to normal controls.
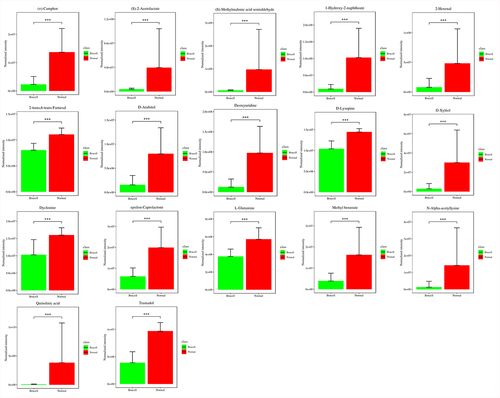
Figure 5. Potential biomarkers were detected using LC-MC approach in CSF samples. The figures normalized to total peak area of each metabolite were presented as mean + SD. *p < 0.05, **p < 0.01, ***p < 0.001 in comparison to normal controls.
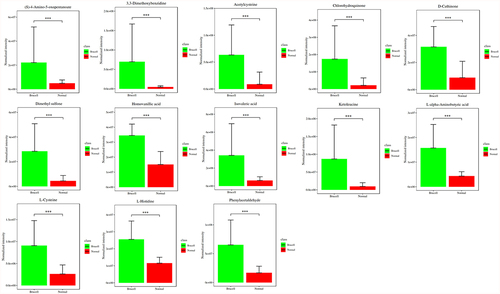
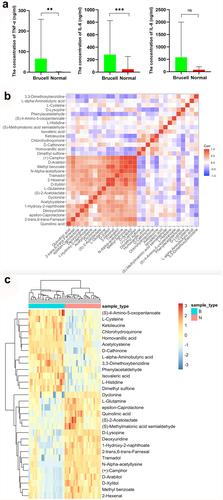
Figure 6. The levels of inflammatory cytokines TNF-α, IL-6 and IL-8 were measured with ELISA (a); The correlation between 30 metabolites in CSF samples (b) and their normalized heatmap (c) in neurobrucellosis cases. **p < 0.01, ***p < 0.001 in comparison to normal controls.
Data availability statement
All data generated or analyzed during this study are included in this published article.