Figures & data
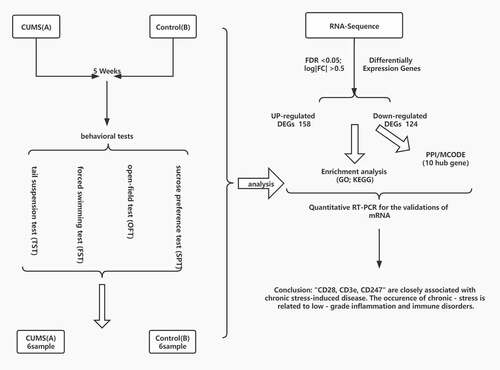
Table 1. Chronic unpredictable mild stress (CUMS) procedure
Table 2. Gene primer sequence
Figure 1. CUMS leads the mice to express depression-like behaviors. Mice were subjected to the adaptation for a week, the CUMS for 5 weeks. (a) The values of central distance in the Spontaneous Activities were 1766.91 ± 349.1 mm in CUMS-treated mice (n = 12) and 3140.31 ± 115.6 mm in controls (P < 0.01). (b) The values of central time in the Spontaneous Activities were 51.32 ± 6.2 seconds in CUMS-treated mice and 93.26 ± 5.5 seconds in controls (P < 0.001). (c) The values of immobility time in TST were 86.42 ± 31.3 seconds in CUMS-treated mice (n = 12) and 12.28 ± 6.3 seconds in control mice (P < 0.05). (d)The values of immobility time in FST were 168.30 ± 14.4 seconds in CUMS-treated mice (n = 12) and 111.67 ± 6.3 seconds in control mice (P < 0.01). (e) The values of SPT is 51.87 ± 4.2 seconds in CUMS-treated mice and 79.41 ± 1.7 seconds in controls (P < 0.0001). The results are expressed as mean ± SEM. n = 12 per group, ***P < 0.001 ****P < 0.0001 compared with control.
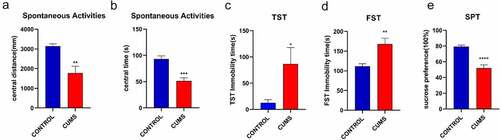
Figure 2. a Reflect the difference caused by the comparison in the volcano map, gray is the genes with insignificant differences, and red and blue are genes with significant differences. The horizontal axis is log2FoldChange, and the vertical axis is – log10FDR. b The red is the figure indicates the relatively high expression protein coding gene, and the green indicates the relatively low expression protein coding gene.
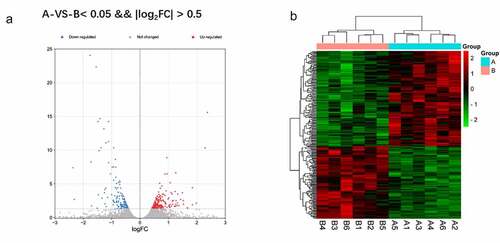
Figure 3. a/b The horizontal axis is the name of GO item, and the vertical axis is log10pValue. c The horizontal axis of the figure is the enrichment score. The larger the bubble, the more the number of differential protein encoding gene. The bubble color changes from red-purple-blue, the smaller the enrichment p Value, the greater the significance.
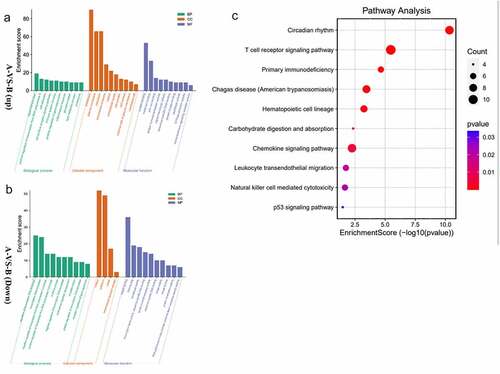
Figure 4. a The protein-protein interaction network consists of 66 nodes and 176 edges. Color and size represent the connectivity degree of nodes. b The most highly connected cluster is composed of ten ‘Lck, Cd3e, Cd4, Cd3g, Cd3d, Cd8a, Prkcq, itk,’ Cd28, Cd247 hub genes.
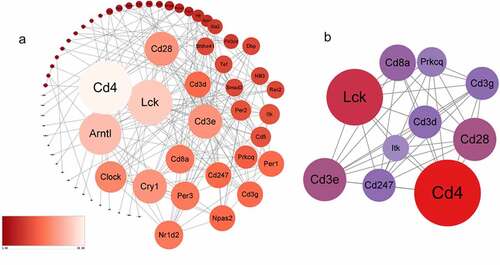
Figure 5. The validation of differentially expressed mRNAs in the lung tissue from mice with CUMS-induced depression-like behaviors and controls. Notes: Ten mRNAs were involved in immue pathways and were selected for qRT-PCR analysis(a) qRT-PCR was used to analyze the relative values of Lck, Cd3e, Cd4, Cd3g, Cd3d, Cd8a, Prkcq, itk, Cd28, Cd247 from mice with CUMS-induced depression-like behaviors and controls (n = 6 per group), in which GAPDH was used for endogenous control (b) The relative level of of Lck, Cd3e, Cd4, Cd3g, Cd3d, Cd8a, Prkcq, itk, Cd28, Cd247 gene expression from mice with CUMS-induced depression like behaviors (n = 6) and controls (n = 6), which were analyzed using 18s as the internal control. The relative values for control mice were normalized to be one. The data are expressed as mean ± SEM. *P < 0.1, **P < 0.01.