Figures & data
Table 1. Primer sequences
Figure 1. Effect of TAK1 activation on HK-2 cell apoptosis induced by high glucose (a) Apoptosis in different group of HK-2 cells was detected by flow cytometry; (b) Apoptosis in different group of HK-2 cells was detected by TUNEL; (c) The protein expression of p-TAK1, Bax and Bcl-2 was detected by immunofluorescence staining in HK-2 cell; (d) The protein expression of p-TAK1, t-TAK1, Bax, and Bcl-2 was detected by Western blot. All experiments were repeated 3 times. **P < 0.01 vs. NG group, #P < 0.05 and ##P < 0.01 vs. HG group. NG, 5.5 mmol/l glucose; M, 5.5 mmol/L glucose+24.5 mmol/L mannitol; HG, 30 mmol/L glucose; HG+5Z; 30 mmol/L glucose+600 nmol/L TAK1 inhibitor 5Z-7- oxozeaenol.
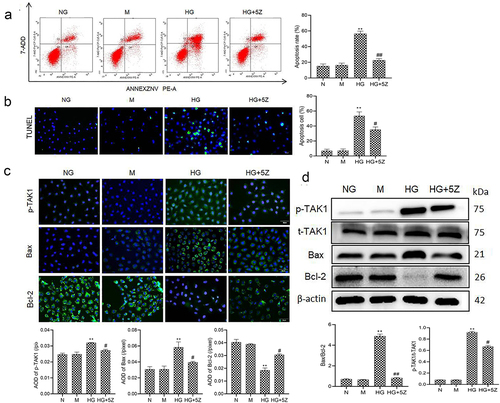
Figure 2. Effects of 5Z-7-oxozeaenol on HG-induced activation of related protein of TGF-β1/p38 MAPK pathway. All experiments were repeated 3 times. **P < 0.01 vs. NG group, ##P < 0.01 vs. HG group.
Figure 3. Effects of 5Z-7-oxozeaenol on HG induced oxidative stress in HK-2 cells. (a) Intracellular ROS of HK-2 cells was detected by flow cytometry; (b) Mitochondrial ROS of HK-2 cells was detected by MitoSOX staining; (C, D, E, F) The mRNA expression of TGF-β1, HO-1, NOX4 and NOX1 in HK-2 cells was detected by real-time quantitative PCR. All experiments were repeated three times. **P < 0.01 vs. NG group, #P < 0.05 and ##P < 0.01 vs. HG group.
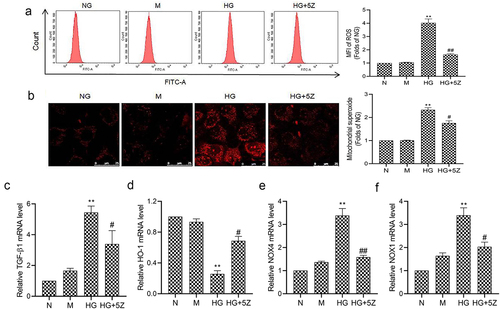
Figure 4. Effects of SB203580 on TAK1 overexpression induced apoptosis in HK-2 cells. (a) Apoptosis was detected by flow cytometry; (b) Apoptosis was detected by TUNEL; (c) The protein expression of TGF-β1, Bax and Bcl-2 in HK-2 cells was detected by immunofluorescence staining. (d) The protein expression of TGF-β1 was detected by Western blot; (e) The protein expression of Bax and Bcl-2 was detected by Western blot; All experiments were repeated 3 times. *P < 0.05 vs. NG group, #P < 0.05 and ##P < 0.01 vs. NG+ pEX-3-TAK1 group. NG, 5.5 mmol/l glucose; NG+ pEX-3-TAK1, 5.5 mmol/L glucose+0.5 mg/L pEX-3-TAK1; NG+ pEX-3-TAK1+ SB203580; 5.5 mmol/L glucose+0.5 mg/L pEX-3-TAK1 + 15 μmol/L p38MAPK inhibitor SB203580.
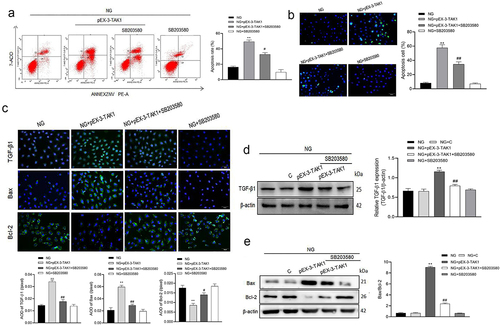
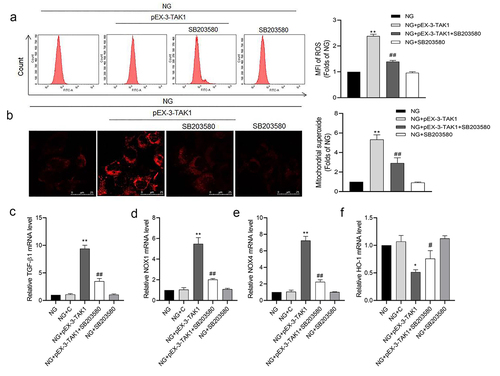
Figure 5. Effects of p38 MAPK inhibitor SB203580 on TAK1 overexpression induced oxidative stress in HK-2 cells. (a) Intracellular ROS was detected by flow cytometry; (b) Mitochondrial ROS was detected by MitoSOX staining. (C, D, E, F) The mRNA expression of TGF-β1, NOX1, NOX4 and HO-1 in HK-2 cells was detected by real time quantitative PCR. All experiments were repeated three times. *P < 0.05 and ** P < 0.01 vs. NG group, #P < 0.05 and ##P < 0.01 vs. NG+pEX-3-TAK1 group. NG+C, 5.5 mmol/L glucose+ 0.5 mg/L pEX-1 empty plasmid.