Figures & data
Figure 1. Expression levels of HIF1A-AS2 and contractile phenotypes markers in human aortic tissues. (a) HIF1A-AS2 was elevated in AD tissues (n = 8) versus to that of control (n = 8) by qRT-PCR and (b) FISH assay (Scale bar = 25 μm). (c) The SMC contractile phenotypes markers (α-SMA, SM22α, calponin, and MYH11) were reduced in human AD tissues relative to that of control by Western blotting assay. (d) The correlation between HIF1A-AS2 and contractile phenotype markers (α-SMA, SM22α) were negatively. *P < 0.05, **P < 0.01.
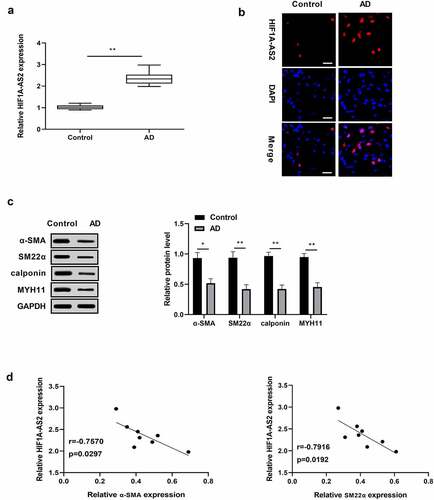
Figure 2. Knockdown of HIF1A-AS2 suppressed SMCs proliferation and migration, while promoted phenotypic switching. (a) The expression of HIF1A-AS2 was detected by qRT-PCR in si-HIF1A-AS2-transfection SMCs. (b) The effect of si-HIF1A-AS2 on SMCs viability was determined by CCK-8 assay. (c) The effect of si-HIF1A-AS2 on Ki67 positive cells was measured by Immunofluorescence assay (Scale bar = 50 μm). (d) The effect of si-HIF1A-AS2 on cell migration was detected by transwell assay (Scale bar = 50 μm). (e) The effect of si-HIF1A-AS2 on α-SMA, SM22α, calponin, and MYH11 protein levels were examined by Western blotting. *P < 0.05,** P < 0.01, *** P< 0.001.
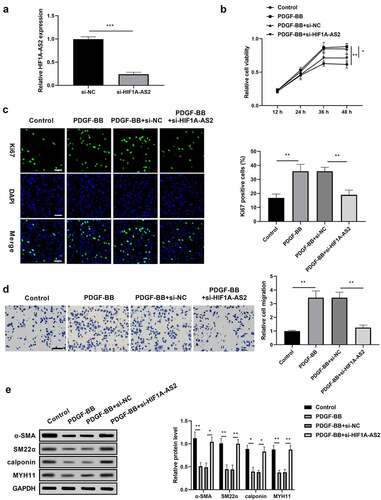
Figure 3. HIF1A-AS2 directly interacted with miR-33b in SMCs. (a) The binding sites of HIF1A-AS2-WT and HIF1A-AS2-MuT in the miR-33b were shown using starBase. (b) The expression of miR-33b was detected by RT-qPCR in SMCs treatment with miR-33b mimic or inhibitor. (c) The luciferase activity was measured in SMCs treatment with miR-33b mimic. (d) RIP analysis of HIF1A-AS2 or miR-33b expression in Ago2 and IgG group. (e) The targeting relations of HIF1A-AS2 and miR-33b were confirmed by RNA pull-down assay. (f) miR-33b expression in si-HIF1A-AS2-treated SMCs was measured by qRT-PCR. (g) miR-33b expression in AD tissues was detected by qRT-PCR. (h) Spearman correlation analysis of the correlation between HIF1A-AS2 and miR-33b. **P < 0.01, ***P < 0.001.
Figure 4. HMGA2 was a direct target of miR-33b and positively regulated by HIF1A-AS2. (a) The HMGA2 3'UTR-WT and HMGA2 3'UTR-MuT in the miR-33b binding sites were shown using TargetScan. (b) Luciferase activity of HMGA2 was measured in SMCs treatment with miR-33b mimic. (c) HMGA2 mRNA and (d) protein expression was detected in SMCs treatment with miR-33b mimic or inhibitor. (e) HMGA2 mRNA and (f) protein expression was measured in SMCs after transfection with si-HIF1A-AS2 or combined with miR-33b mimic or inhibitor. (g) HMGA2 expression was detected by qRT-PCR in AD tissues. (h) Spearman correlation analysis of the relationship between HIF1A-AS2 and HMGA2 in AD tissues. *P < 0.05, **P < 0.01.
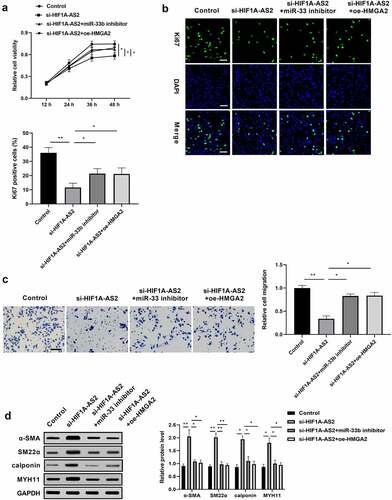
Figure 5. HIF1A-AS2 modulated SMCs proliferation, migration, and phenotypic switching via miR-33b/HMGA2 axis. SMCs were treated with si-HIF1A-AS2, meanwhile with miR-33b inhibitor or oe-HMGA2. (a) SMCs viability was detected by CCK-8 assay. (b) Ki67 positive cells were measured by Immunofluorescence. (c) The cell migration of SMCs was detected by transwell assay. (d) The protein levels of α-SMA, SM22α, calponin, and MYH11 were measured by Western blotting. *P < 0.05, **P < 0.01.