
Figures & data
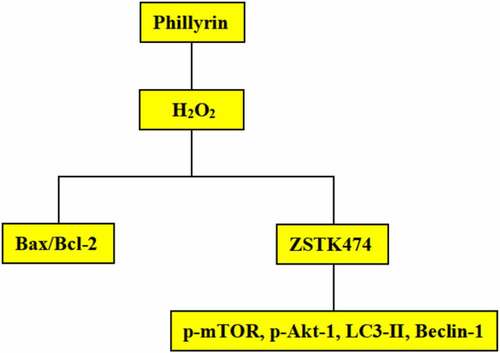
Figure 1. Phillyrin improved the MCAO/R rat brain injury. (a) Schematic diagram of chemical structure of phillyrin. (b) The cerebral infarction analyzed by TTC staining. (c) Percentage of cerebral infarction volume. (d) Neurological deficits of rats. (e) Brain water content of rats. (f) Surviving neuron number in the prefrontal cortex and hippocampus analyzed by H&E staining. (g) Percentage of infarct neurons in prefrontal cortex and hippocampus of rats. Note: n = 6; *P < 0.05 and **P < 0.01 compared with I/R group, ## P < 0.01 compared with the sham group.
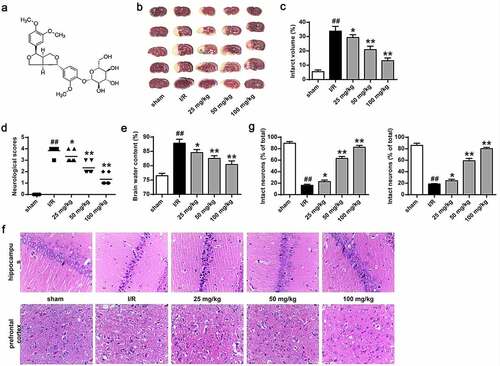
Figure 2. Phillyrin improved the activity of primary neurons damaged by H2O2. (a) Cell viability treated with different concentrations of H2O2. (b) Cell viability treated with H2O2 (100 μM) at different time. (c) Effects of phillyrin at different concentrations on H2O2-treated neuron cell viability. (d) Effects of phillyrin with different concentrations on LDH release in H2O2- treated neuron cells. (e) Images of Hoechst staining of neurons and apoptosis rate of neurons in each group. (f, g) Effects of phillyrin with different concentrations on Bax and Bcl-2 expression in H2O2- treated neurons. (h, i) Effects of phillyrin with different concentrations on pro-caspase-3 expression in H2O2- treated neurons. Note: n = 6; *P < 0.05 and **P < 0.01 compared with the H2O2 group; # P < 0.05 and ## P < 0.01 compared with the control group.
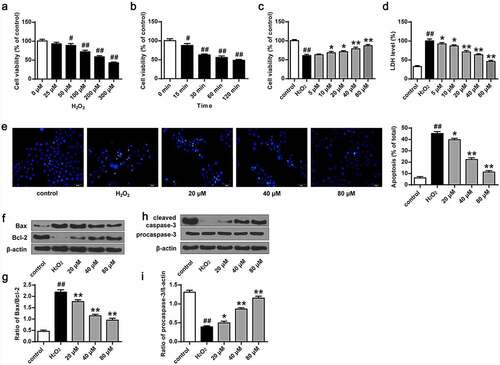
Figure 3. Phillyrin promoted Akt-1 phosphorylation in primary neurons. (a) Western blot showing (a) the effects of H2O2 (100 μM) at different treatment time on Akt and p-Akt-1 levels, (b) the effects of phillyrin at different treatment time on Akt and p-Akt-1 levels in H2O2-treated rat cortical neurons, and (c) the effects of phillyrin at different concentrations on Akt and p-Akt-1 levels in H2O2-treated rat cortical neurons. Note: n = 6; #P < 0.05 and ##P < 0.01 compared with control group.
Figure 4. Phillyrin enhanced autophagy of H2O2-treated primary neuron cells. Western blot analysis showing the effects of phillyrin with different concentrations on mTOR (a), LC3 (b), and beclin-1 (c) in H2O2-treated neurons, and (d) the effects of ZSTK474 on the effects of phillyrin in H2O2-treated neurons. (e) LDH release from H2O2-treated neurons with different treatments. Note: n = 6; * P < 0.05 compared with the H2O2 group; **P < 0.01 compared with the H2O2 group; &&P < 0.01 compared with the phillyrin group; ##P < 0.01 compared with the control group.