Figures & data

Figure 1. Ferrostatin-1 alleviates CoNP-induced cytotoxicity in Balb/3T3 cells. (a) Viability of cells incubated with different CoNPs concentrations after 6, 24, and 48 hours. (b) Cell viability after 24 h of treatment with different concentrations of Ferrostatin-1. (c) Viability of cells incubated with different concentrations of Ferrostatin-1 and CoNPs (400 μM) after 24 h of treatment. (d) Number and state of cells after 24 h of treatment with Ferrostatin-1 (1 μM)and CoNPs (400 μM). All the data are shown as mean ± SD of at least 3 replicates. *p < 0.05, **p < 0.01 versus the control group. #p < 0.05, ##p < 0.01 versus the CoNPs group.
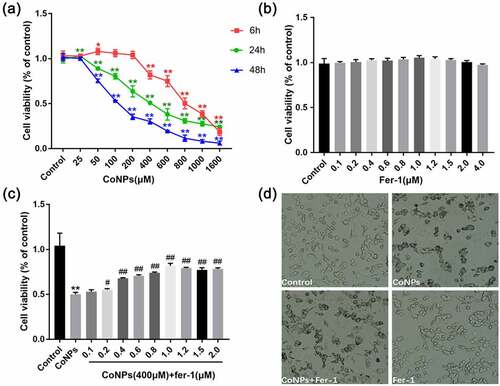
Figure 2. Ferrostatin-1 suppresses CoNP-induced production of ROS and MDA in Balb/3T3 cells. Cells were treated with CoNPs (400 μM) and Ferrostatin-1 (1 μM) for 24 h. (a-d) Observation of cells under an inverted fluorescence microscope (magnification = 400X), and the green fluorescence was the ROS detected by the DCFH-DA probe. (e). Intracellular MDA content in different treatment groups. All the data are shown as mean ± SD of at least 3 replicates. **p < 0.01 versus the control group. ##p < 0.01 versus the CoNPs group.
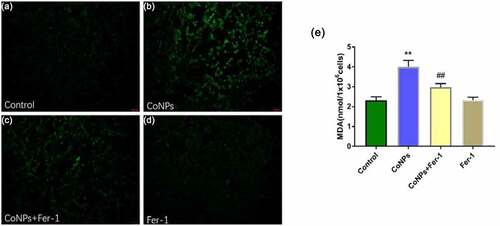
Figure 3. Ferrostatin-1 improves CoNPs-induced expression of GSH, GPX4, and SLC7A11 proteins in Balb/3T3 cells. (a) Levels of intracellular GSH across different treatment groups. (b-d) Western blots showing expression of GPX4 and SlC7A11 proteins. All the data are shown as mean ± SD of at least 3 replicates. **p < 0.01 versus the control group. ##p < 0.01 versus the CoNPs group.
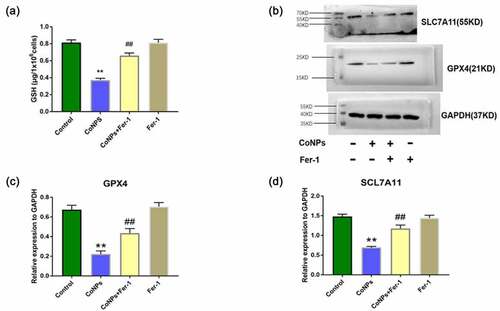
Figure 4. Ferrostatin-1 treatment significantly affects Cobalt and Iron concentration in Balb/3T3 cells. (a) ICP-MS spectrum showing the concentration of Cobalt in cells across different treatment groups. (b) Iron concentrations in cells across different treatment groups after iron assay. All the data are shown as mean ± SD of at least 3 replicates. **p < 0.01 versus the control group. ##p < 0.01 versus the CoNPs group.
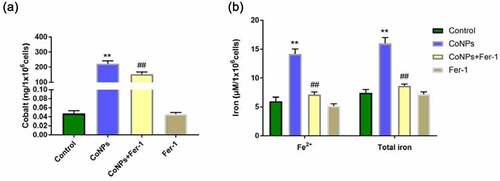
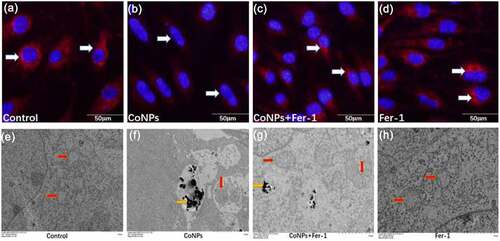
Figure 5. Ferrostatin-1 protects Balb/3T3 cells from CoNPs-induced toxic damage. (a-d) Cell observation under an inverted fluorescence microscope (magnification = 400X). Red fluorescence denotes mitochondrial membrane potential detected by the MitoTracker Red probe. (e-h) Ultrastructure of cells as observed under a TEM. The yellow arrows indicate CoNPs in the cytoplasm, while the red arrows indicate the mitochondria.