
Figures & data
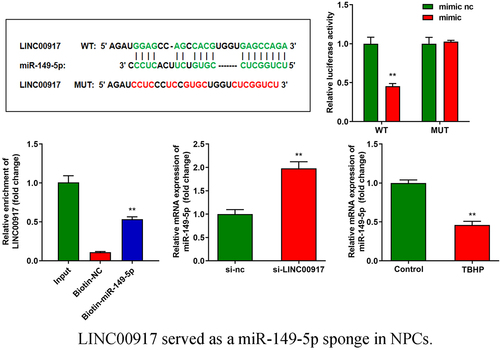
Figure 1. LINC00917 was up-regulated in IDD. A The LINC00917 expression levels in IDD tissues. B The LINC00917 expression in NPCs. **P < 0.01.
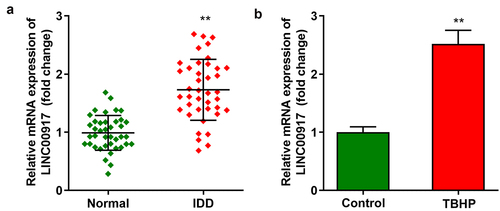
Figure 2. Knockdown of LINC00917 promoted proliferation, and relieved the pyroptosis and inflammation of the TBHP treated NPCs. A Validation of transfection efficiency. B-C MTT and EdU assays were performed to measured the proliferation. D-G The LDH, IL-6, TNF-α, and IL-1β levels were determined with corresponding kits. H The pyroptosis rate was detected with flow cytometry. I The protein expressions of NLRP3, GSDMD-N and Caspase1. *P < 0.05, **P < 0.01 VS Control group; #P < 0.05, ##P < 0.01 VS TBHP+si-nc group.
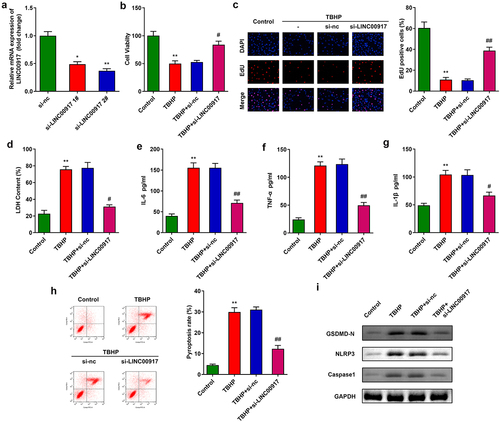
Figure 3. LINC00917 served as a miR-149-5p sponge in NPCs. A Binding sites between miR-149-5p and LINC00917 predicted by starBase. B-C The relationship between LINC00917 and miR-149-5p verified by dual-luciferase reporter and RNA pull-down assays. D The miR-149-5p expression detected after si-LINC00917 transfection. E The miR-149-5p expression levels in NPCs. **P < 0.01.
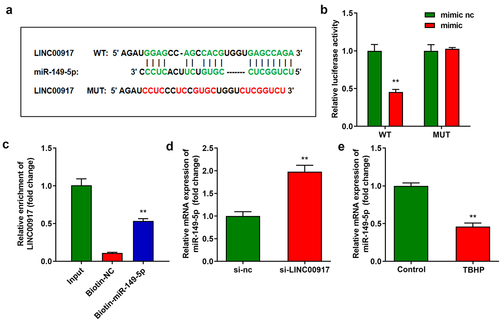
Figure 4. NLRP1 is targeted by miR-149-5p. A Binding sites between miR-149-5p and NLRP1 predicted by TargetScan. B-C Dual-luciferase reporter and RNA pull-down assays conducted to verify the relationship between NLRP1 and miR-149-5p. D The NLRP1 expression detected by RT-qPCR. E The NLRP1 expression in NPCs. **P < 0.01. **P < 0.01.
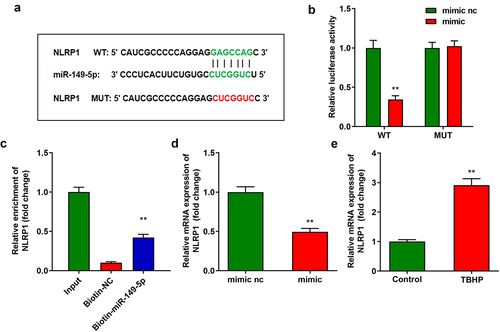
Figure 5. LINC00917 regulated the functions of the NPCs via miR-149-5p/NLRP1 axis. A-B Validation of transfection efficiency. C-D MTT and EdU assays were performed to measured the proliferation. E-H The LDH, IL-6, TNF-α, and IL-1β levels determined with corresponding kits. I The pyroptosis rate detected with flow cytometry. J The protein expressions of NLRP3, GSDMD-N and Caspase1 measured by Western blot. *P < 0.05, **P < 0.01 VS Control group; #P < 0.05, ##P < 0.01 VS TBHP group; $P < 0.05 VS TBHP+si-LINC00917+ inhibitor nc+oe-nc group.
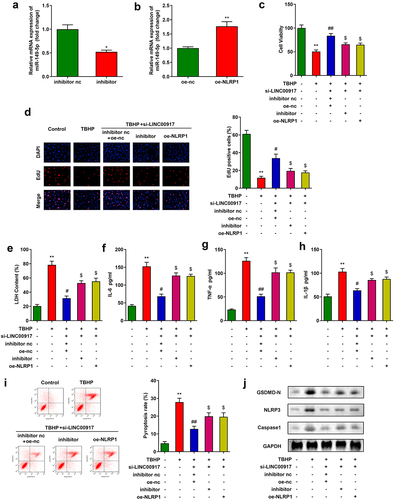
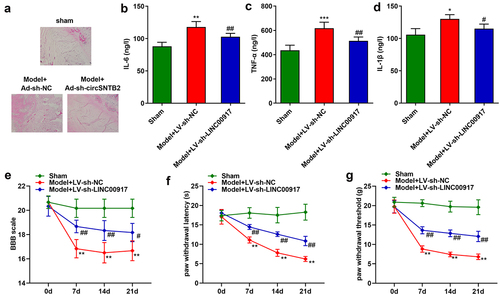
Figure 6. Knockdown of LINC00917 relieved the IDD progression in vivo. A HE staining for IDD mice. B-D The IL-6, TNF-α, and IL-1β levels were determined with corresponding kits. E-G The determination of mouse behavior. *P < 0.05, **P < 0.01, *P < 0.001 VS Sham group; #P < 0.05, ##P < 0.01 VS Model+LV-sh-NC group.
Data Availability Statement
The datasets used and analyzed during the current study are available from the corresponding author on reasonable request.