Figures & data
Figure 1. The effect ox-LDL on the RAW264.7 macrophages. (a) CCK-8 assay was used to measure the cell viability. (b) ELISA assay was applied to detect the levels of IL-1β, IL-6, and TNF-α. (c) related-proteins expression were detected by Western blotting. *P < 0.05, **P < 0.1, compared with 0 μg/mL.
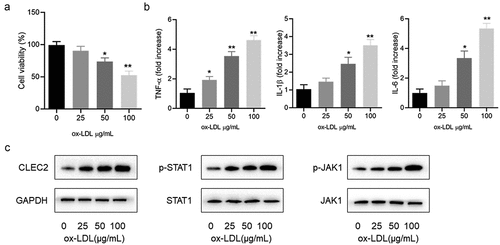
Figure 2. CLEC2 knockdown reversed the cell activity and apoptosis in ox-LDL-induced macrophages. (a) The expression level of CLEC2 was observed by Western blotting (transfected for 48 h). (b) Cell viability was detected using CCK-8 assay. (c) Apoptosis was detected by flow cytometry. (d) Western blotting was applied to detect the protein expression levels. **P < 0.01 compared with control; #P < 0.05 compared with ox-LDL+siControl.
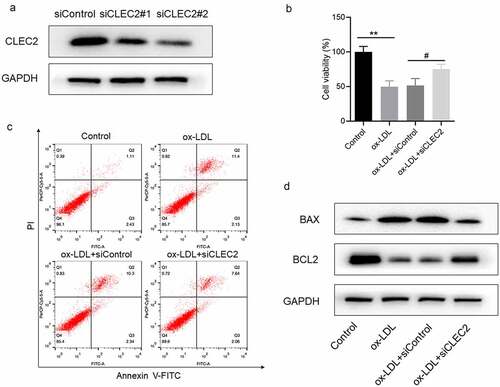
Figure 3. CLEC2 knockdown inhibited ox-LDL-induced inflammatory response and lipid accumulation in macrophages. (a) The levels of inflammatory cytokines were detected by ELISA. (b) Lipid accumulation was detected by oil red O staining, the area was measured by Image Pro Plus. (c) The contents of TC and FC were measured using colorimetric kits. (d) Western blotting was applied to detect the levels of protein expression. **P < 0.01 compared with control; #P < 0.05 compared with ox-LDL+siControl.
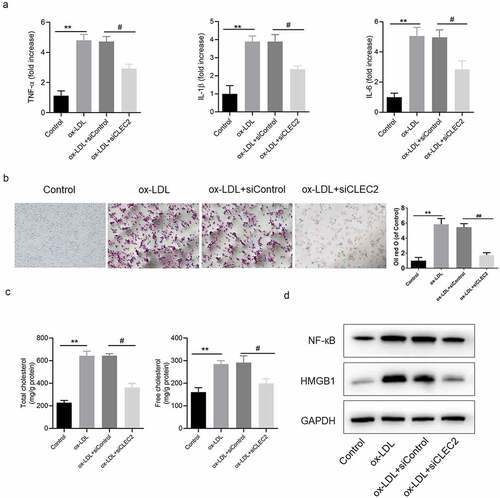
Figure 4. JAK1/STAT1 signaling regulated the expression of CLEC2 and affected the cell viability and apoptosis. (a) The expression of JAK1/STAT1 signaling was detected with Western blotting. (b) The cell viability was detected with CCK-8 assay. (c) Western blotting was applied to detect the expression of proteins. (d) Apoptosis was detected with flow cytometry. *P < 0.05 compared with control, or ox-LDL+siControl; #P < 0.05 compared with ox-LDL+ DMSO; &P < 0.05 compared with ox-LDL+Baricitinib.
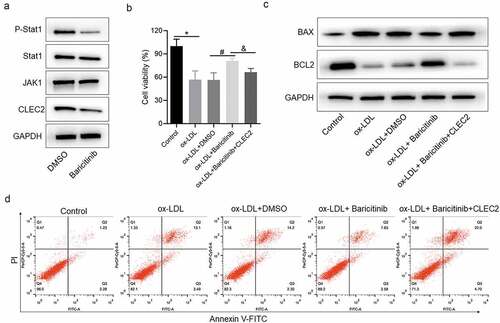
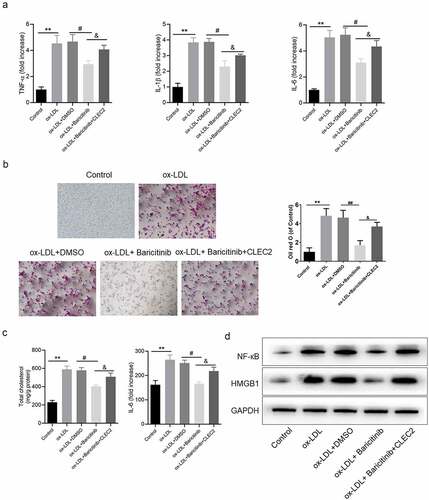
Figure 5. JAK1/STAT1 pathway affected the inflammatory response and lipid accumulation. (a) The levels of inflammatory cytokines were detected by ELISA. (b) Lipid accumulation was detected by oil red O staining, and the area was measured by Image Pro Plus. (c) The contents of TC and FC were measured by colorimetric kits. (d) The protein expression levels were measured by Western blotting. **P < 0.01 compared with control; #P < 0.05 compared with ox-LDL+ DMSO; &P < 0.05 compared with ox-LDL+Baricitinib.