
Figures & data
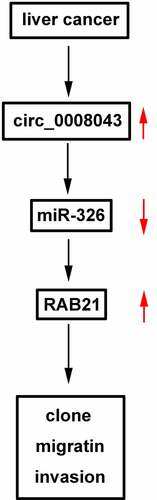
Table 1. Clinicopathologic characteristics of study subjects
Figure 1. Circ_0008043 is highly expressed in liver cancer. (a) The differentially expressed circRNAs in HCC tissues were evaluated using microarray analysis and visualized by volcano plots. Blue points are downregulated circRNAs, and red points are upregulated circRNAs. qPCR was performed to detect the (b) circ_0070467, (c) circ_0025332, (d) circ_0002141, (e) circ_0008043, and (f) circ_0008844 expression in HCC and adjacent non-tumor tissues. (g) ROC curve for circ_0008043. (h) qPCR was conducted in HCC cells (Hep3B, SNU449, Huh7, Focus, MHCC97H, HA22T, and HCCLM3) and normal THLE3 cells. *P < 0.05. **P < 0.01. ***P < 0.001.
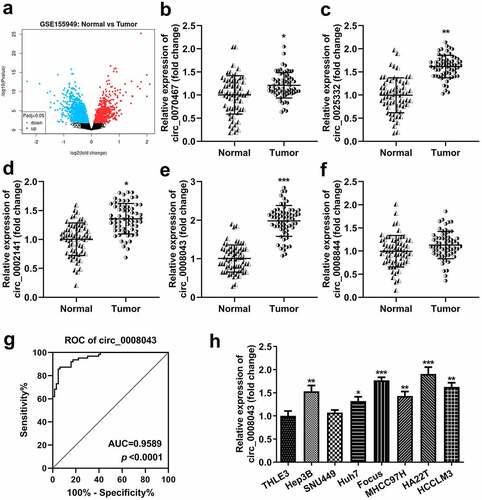
Figure 2. Circ_0008043 is a stable circular transcript. (a) qPCR was used to analyze the resistance of circular and linear RNA to RNase R. (b) The stability of circular and linear RNA was assessed using qPCR after actinomycin D treatment. **P < 0.01.
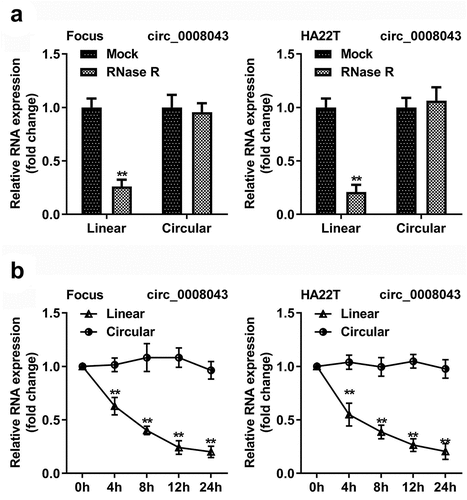
Figure 3. Interfering of circ_0008043 inhibits HCC cell proliferation. (a) The circ_0008043 expression was detected using qPCR post-transfection. Cell proliferation was analyzed by (b) MTT assay and (c) colony formation assay. **P < 0.01. ***P < 0.001.
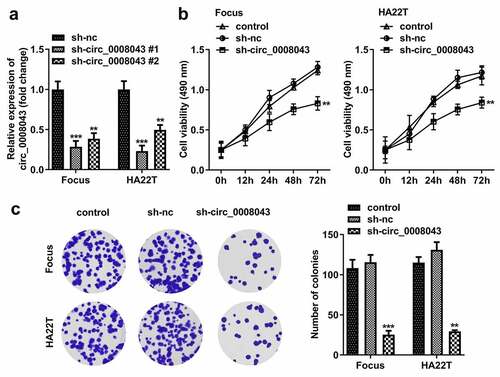
Figure 4. Interfering of circ_0008043 inhibits HCC cell migration and invasion. (a) Transwell assay without Matrigel was performed to evaluate cell migration. (b) Transwell assay with Matrigel was conducted to assess cell invasion. (c) qPCR was utilized to measure E-cadherin, N-cadherin, and vimentin expression. **P < 0.01. ***P < 0.001.
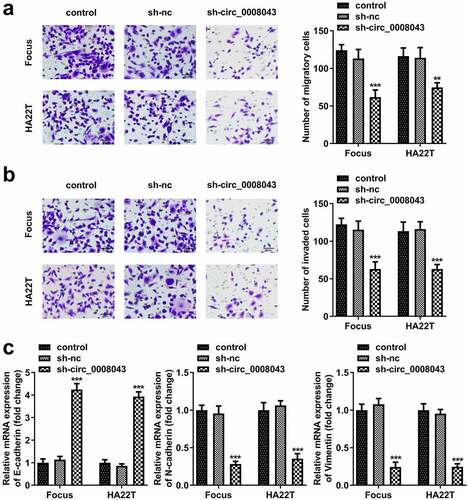
Figure 5. Interfering of circ_0008043 impedes tumor growth in vivo. (a) The tumors after resection were photographed with a ruler. (b) Tumor weight was measured after resection. (c) Tumor volume was detected every 7 days from day 7 to 28 post-transfection. **P < 0.01.
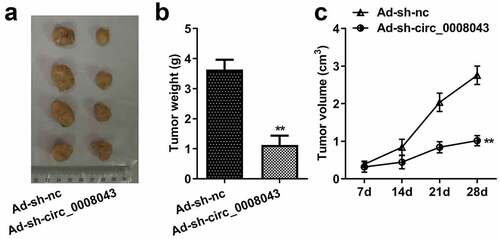
Figure 6. Circ_0008043 is a miR-326 sponge. (a) The sequences of wt circ_0008043 binding to miR-326 and the mut circ_0008043 sequences. The direct relationship between circ_0008043 and miR-326 was determined using (b) dual-luciferase reporter assay and (c) RNA pull-down assay. (d) MiR-326 expression was tested using qPCR following circ_0008043 knockdown. The miR-326 levels were tested using qPCR in (e) HCC/normal cells and (f) tumor/normal tissues. **P < 0.01. ***P < 0.001.
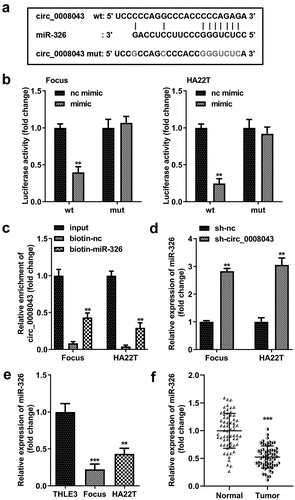
Figure 7. Circ_0008043 plays a tumor-promoting role in HCC by sponging miR-326. (a) MiR-326 expression was examined using qPCR following transfection with inhibitor or mimic. (b) MTT and (c) colony formation assays were conducted to evaluate cell proliferation. (d) Cell migration and (e) invasion were assessed using transwell assay. (f) qPCR was utilized to measure E-cadherin, N-cadherin, and vimentin expression. **P < 0.01. ***P < 0.001. #P < 0.05. ##P < 0.01. ###P < 0.001.
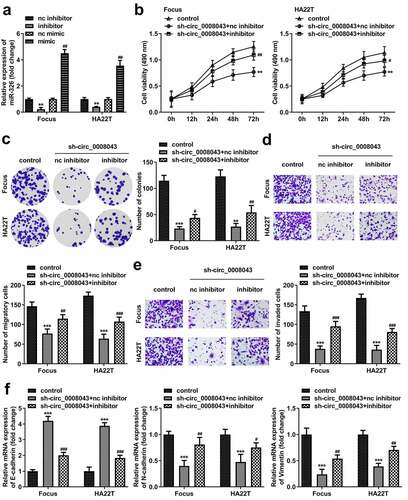
Figure 8. RAB21 is a miR-326 downstream target. (a) The wt RAB21 sequences binding to miR-326 and the mut RAB21 sequences are shown. (b) Dual-luciferase reporter assay and (c) RNA pull-down assay were performed to analyze the interaction between miR-326 and RAB21. (d) RAB21 expression was detected after downregulated circ_0008043 and miR-326 using qPCR. RAB21 was tested using qPCR in (e) HCC/normal cells and (f) tumor/normal tissues. **P < 0.01. ***P < 0.001. ##P < 0.01.
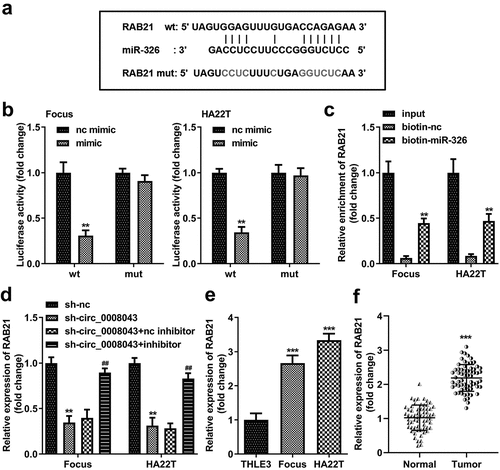
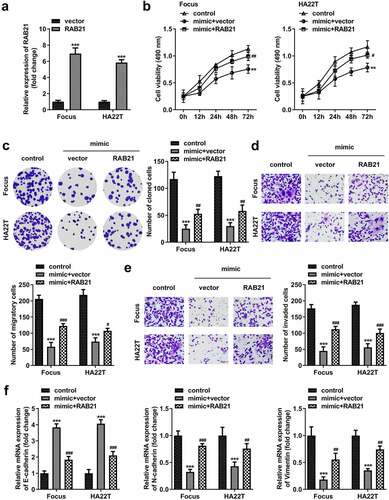
Figure 9. RAB21 rescues the miR-326 effect on HCC cells. (a) RAB21 expression was examined using qPCR post-transfection. (b) MTT and (c) colony formation assays were conducted to assess the proliferation. Transwell assay was used to assess (d) cell migration and (e) invasion. (f) qPCR was utilized to measure E-cadherin, N-cadherin, and vimentin levels. **P < 0.01. ***P < 0.001. #P < 0.05. ##P < 0.01. ###P < 0.001.
Data Availability Statement
The datasets used and analyzed during the current study are available from the corresponding author on reasonable request.