Figures & data
Figure 1. miR-143 showed a negative relation to HMGA2 level within PTC. (a) In comparison to paired healthy tissues, the expression of miR-143 was lower in PTC. *p < 0.05. (b) In comparison with healthy Nthy-ori3-1 cells, miR-143 expression declined in different PTC cells. *p < 0.05. (c) HMGA2 level markedly elevated within PTC. TCGA-derived data. *p < 0.05. (d) HMGA2 protein expression elevated within PTC. (e) miR-143 level showed negative relation to HMGA2 level.
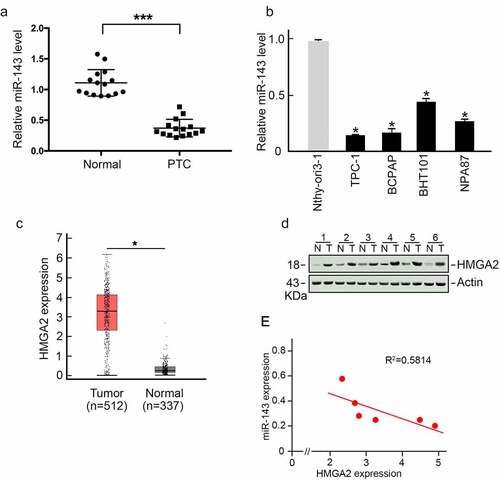
Figure 2. HMGA2 served as miR-143ʹs direct target. (a) Sketch map showing the possible miR-143 binding site in the HMGA2 3’-UTR. (b) miR-143 mimics transfection and increased expression of miR-143 in TPC-1 cells. *p < 0.05. (c) miR-143 overexpression decreased the HMGA2 mRNA level in TPC-1 cells. *p < 0.05. (d) miR-143 overexpression reduced the HMGA2 protein level in TPC-1 cells. (e) Dual-luciferase reporter assay. miR-143 mimic or mimics-NC was co-transfected with HMGA2-MUT or HMGA2-WT 3’-UTR of HMGA2 into TPC-1 cells. At 48 h post-transfection, we measured relative luciferase activities. n = 3. *p < 0.05.
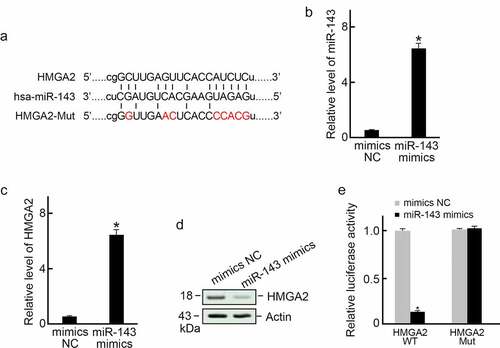
Figure 3. miR-143 overexpression suppresses the proliferation of PTC cells. (a) miR-143 overexpression significantly decreased the viability of TPC-1 cells. *p < 0.05. (b) miR-143 overexpression suppressed TPC-1 clone forming ability. Representative plates were shown (left panel) and the number of colonies were counted (right panel). *p < 0.05. (c) Ki-67-based immunofluorescence staining on miR-143 mimics or corresponding NC-transfected TPC-1 cells. (d) Cyclin E1, PCNA, CDK1, and CDK4 expression within transfected TPC-1 cells was analyzed by immunoblotting, with actin serving as a control.
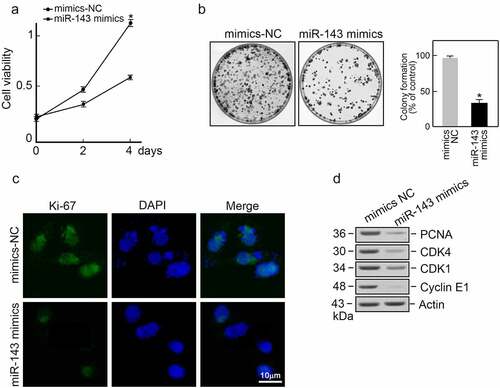
Figure 4. Over-expression of miR-143 inhibits PTC cells metastasis. (a) TPC-1 cells transfected with miR-143 mimics or mimics-NC were subjected to wound healing assay. Representative images were shown. scale bar = 250 μm. (b) Over-expression of miR-143 decreased wound healing speed in TPC-1 cells analyzed from (A). *p < 0.05. (c) TPC-1 cells transfected with miR-143 mimics or mimics-NC were subjected to the trans-well assay with or without Matrigel. Representative images were shown. scale bar = 100 μm (d) Over-expression of miR-143 decreased TPC-1 cells migration and invasion analyzed from (C).
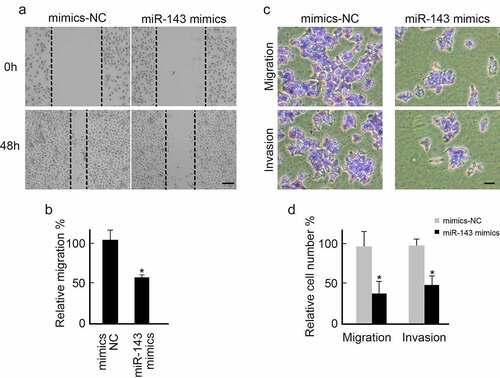
Figure 5. Exogenous expression of HMGA2 restores proliferation capability in miR-143 over-expressed TPC-1 cells. TPC-1 cells were co-transfected with indicated reagents, and (a) Levels of miR-143 were examined by qRT-PCR. *p < 0.05; (b) HMGA2 expression was examined by immunoblotting. Actin was served as a loading control. (c) Exogenous expression of HMGA2 restored cell growth capabilities in TPC-1 cells over-expressed with miR-143. *p < 0.05. (d) Exogenous expression of HMGA2 restored Ki-67 expression in miR-143 over-expressed TPC-1 cells.
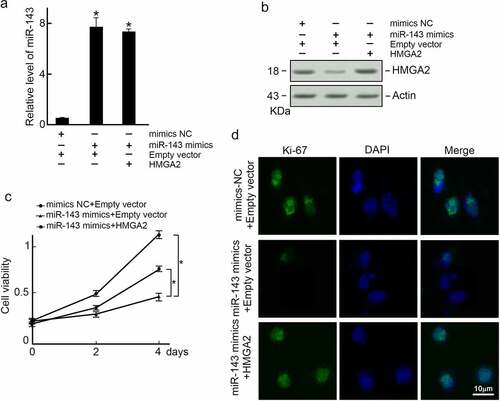
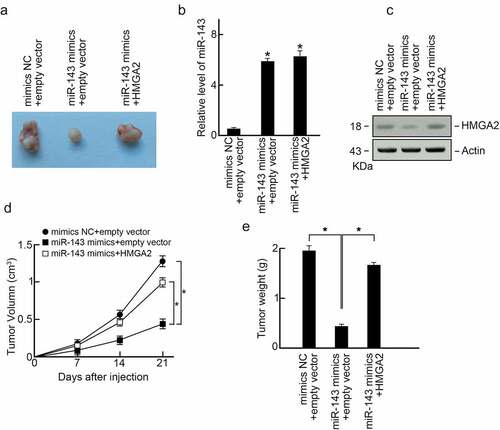
Figure 6. MiR-143 suppresses PTC progression in vivo through HMGA2 (a) Xenograft tumors formed in nude mice. A total of 5 × 10⁶ cells was subcutaneously injected into nude mice (n = 3). The mice were sacrificed on day 21 after the injection. Tumors were isolated, and representative images were shown. (b) Expression of miR-143 in xenograft tumors. (c) Expression of HMGA2 in xenograft tumors. (d) Volumes of xenograft tumors. (e) Weight of xenograft tumors.a.