
Figures & data
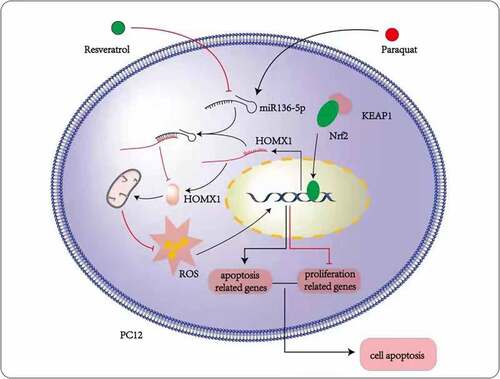
Table 1. Primer sequences for RT-PCR analysis
Figure 1. Impact of PQ on the cell viability, LDH activity, apoptosis, and oxidative stress of PC12 cells. After 24 h of incubation with PQ at increasing doses (200, 400, 800, and 1000 umol/L), cell viability was ascertained by CCK-8, and cell apoptosis was ascertained by flow cytometry. SOD and LDH activities and MDA levels were determined. The results from three separate experiments are expressed as mean ± SD. *P < 0.05,**P < 0.01versus the control group.
Figure 2. Impact of PQ on apoptotic protein, miR-136-5p expression, and Nrf2/HMOX1 signaling pathway activity in PC12 cells. After 24 h of incubation with increasing PQ concentrations (200, 400, 800, and 1000 umol/L), the expression of Bax, caspase-8, caspase-3, Bcl-2, Nrf2, and HMOX1 was determined by Western blot. RT-PCR was employed to estimate the expression of miR-136-5p.The results from three separate experiments are expressed as mean ± SD. *P < 0.05,**P < 0.01versus the control group.
Figure 3. Impact of resveratrol on the viability, oxidative stress, LDH activity, apoptosis, and morphology of PC12 cells treated with PQ. PC12 cells were treated with PQ (800 umol/L) and different resveratrol doses (25, 50, and 75 M) for 24 h. Cell viability was determined by CCK-8, and LDH activity was measured following the manufacturer’s instructions. Morphology was assessed by AO/EB analysis, and SOD activity and ROS and MDA levels were evaluated. Cell apoptosis was determined by flow cytometry. The results from three separate experiments are expressed as mean ± SD. *P < 0.05, **P < 0.01versusthe control group. #P < 0.05, ##P < 0.01versus the model group.
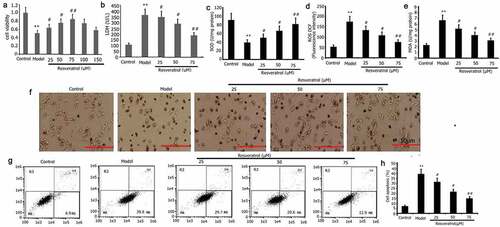
Figure 4. Impact of resveratrol on miR-136-5p expression, apoptotic protein, miR-136-5p expression, and Nrf2/HMOX1 signaling pathway activity in PQ-induced PC12 cells. PC12 cells were treated with PQ (800 umol/L) and resveratrol at varying doses (25, 50, and 75 M) for 24 h. MiR-136-5p expression was estimated by RT-qPCR. Western blot analysis was used to determine the expression of Bax, caspase-8, caspase-3, Bcl-2, Nrf2, and HMOX1 protein. The results from three separate experiments are expressed as mean ± SD. *P < 0.05versus the control group. #P < 0.05, ##P < 0.01versus the model group.
Figure 5. HMOX1 is a downstream miR-136-5p target. A–B: HMOX1 was reduced in PQ-induced PC12 cells with overexpressed miR-136-5p compared with that in the cells with empty vector control (P < 0.05). HMOX1 expression was substantially elevated in the cells with miR-136-5p down-modulation. C–D: HMOX1 mRNA levels decreased after miR-136-5p overexpression in PQ-induced PC12 cells (P < 0.05). Elevated levels following the up-modulation of miR-136-5p (P < 0.05). E: miR-136-5p bound to the 3ʹ-UTR regions of the HMOX1.In mutant HMOX1, the binding process was disrupted. F: Dual-luciferase reporter assay revealed that miR-136-5p mimic bound to the 3ʹ-UTR region of wild-type HMOX1 but not of HMOX1 mutants (P < 0.05).
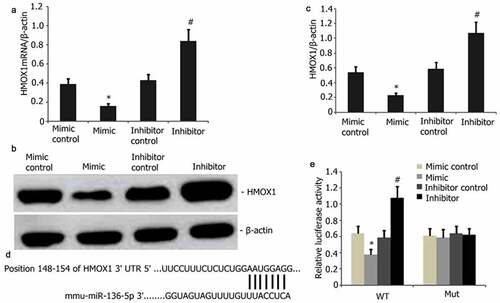
Figure 6. Impact of resveratrol plus miR-136-5p mimic on Nrf2/HMOX1 signaling pathway activity and apoptotic protein expression in PQ-induced PC12 cells. PQ (800 μmol/L) and different resveratrol doses (50 μM) were added to the PC12 cells before being transfected for 24 h using miR-136-5p mimic. Western blot was employed to examine the protein expression of Nrf2, HMOX1, Bax, caspase-8, and caspase-3. The findings are expressed as mean ± SEM. **P < 0.01 versus the control group and only resveratrol group. #P < 0.05 versus the PQ group. ▲P < 0.05 versus the miR-136-5p mimic + PQ group.
Figure 7. Effect of resveratrol plus miR-136-5p mimic on the oxidative stress and morphology of PQ-induced PC12 cells. Transfection of PC12 cells using miR-136-5p mimic was carried out for 24 h in the presence of PQ (800 umol/L) and resveratrol (50 uM). SOD activity and levels of ROS and MDA were determined. PC12 cells morphology was observed by AO/EB analysis, and SOD activity and MDA and ROS levels were determined. The results are expressed as mean ± SEM. *P < 0.05, **P < 0.01 versus the control group and only resveratrol group. #P < 0.05 versus the PQ group. ▲P < 0.05 versus the miR-136-5p mimic + PQ group.
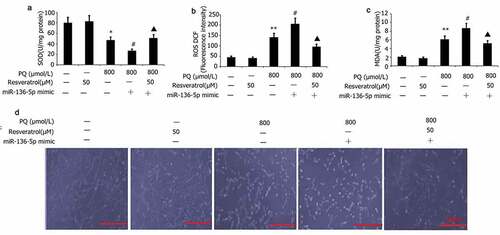
Figure 8. Impact of resveratrol plus miR-136-5p mimic on Ki67 expression in PQ-induced PC12 cells. In order to evaluate if miR-136-5p affected the Ki67 expression in PQ-induced PC12 cells, the cells were transfected using a miR-136-5p mimic in the presence of PQ (800 umol/L) and resveratrol (50 μM) for 24 h. Ki67 was detected by immunofluorescence, and fluorescence intensities were measured. All data are expressed as the mean ± SEM. **P < 0.01 versus the control group and only resveratrol group. #P < 0.05 versus the PQ group. ▲P < 0.05 versus the miR-136-5p mimic + PQ group.
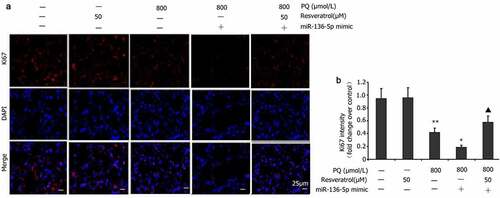
Figure 9. Impact of resveratrol plus miR-136-5p mimic on the viability, LDH activity, and apoptosis of PQ-induced PC12 cells. Transfection of PC12 cells with miR-136-5p mimic was performed for 24 h in the presence of PQ (800 umol/L) and resveratrol (50 μM). The PC12 cells viability was determined utilizing CCK-8, the activity of LDH was estimated according to manufacturer’s instructions, and the apoptosis of PC12 cells was measured utilizing flow cytometry. The data are expressed as mean ± SEM. *P < 0.05, **P < 0.01 versus the control group and only resveratrol group. #P < 0.05 versus group. ▲P < 0.05 versus the miR-136-5p mimic + PQ group.
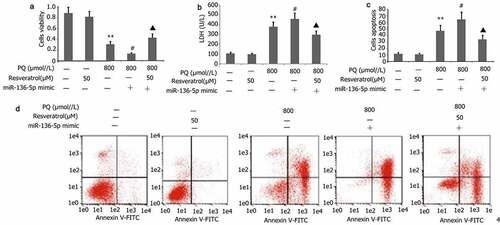
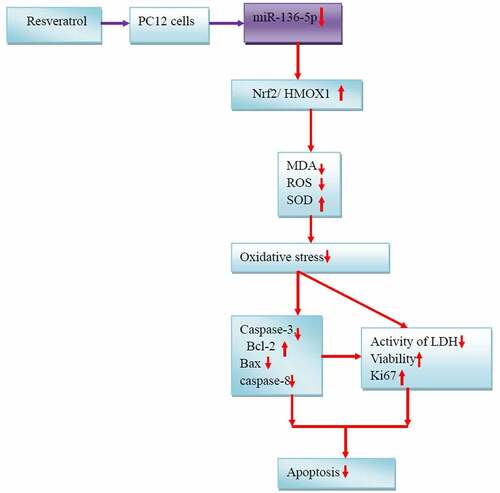
Figure 10. Mechanisms underlying the effects of resveratrol on PQ-induced PC12 cells.
Data availability statement
The datasets utilized and/or studied in this research are accessible upon valid request.