Figures & data
Figure 1. Donepezil increases the cell viability of OGD/R-induced HBMECs. (a) Cell viability of HBMECs treated with donepezil at the concentration of 20, 50, 100 μM was assessed with the help of CCK-8. (b) Cell viability of HBMECs treated with OGD/R and donepezil at the concentration of 20, 50, 100 μM was assessed with the help of CCK-8. Results are the mean ± SD. **P < 0.01, ***P < 0.001.
Figure 2. Donepezil Promotes OGD/R-treated Cell Migration and Angiogenesis in HBMECs. (a-b) The capacity of cell migration in OGD/R-induced HBMECs treated with donepezil (20, 50, 100 μM) was detected employing wound healing. (c-d) The capacity of angiogenesis in OGD/R-induced HBMECs treated with donepezil (20, 50, 100 μM) was assayed by means of tube formation. (e) The expressions of angiogenetic-related proteins VEGF, p-VEGFR2 and VEGFR2 were examined in OGD/R-induced HBMECs treated with donepezil (20, 50, 100 μM) by the way of Western blot. Results are the mean ± SD. *P < 0.05, **P < 0.01, ***P < 0.001.
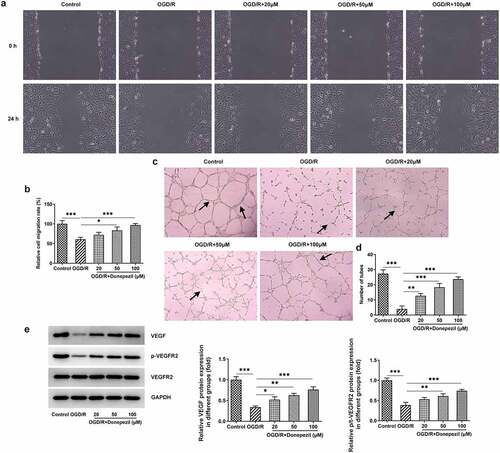
Figure 3. Donepezil decreases OGD/R-induced cell permeability and upregulates tight junction protein expression in HBMECs. (a) The relative fluorescence intensity of OGD/R-induced HBMECs treated with donepezil (20, 50, 100 μM) was measured with the application of in vitro permeability test kit. (b-c) The expressions of related proteins ZO-1, VE-cadherin and Clarudin-1 were determined in OGD/R-induced HBMECs treated with donepezil (20, 50, 100 μM) employing Western blot. Results are the mean ± SD. *P < 0.05, **P < 0.01, ***P < 0.001.
Figure 4. Donepezil regulates the SIRT1/FOXO3a/NF-κB signaling pathways. The expressions of SIRT1, FOXO3a, p-p65 and p65 were detected by the use of Western blot in OGD/R-induced HBMECs treated with donepezil (20, 50, 100 μM). Results are the mean ± SD. **P < 0.01, ***P < 0.001.
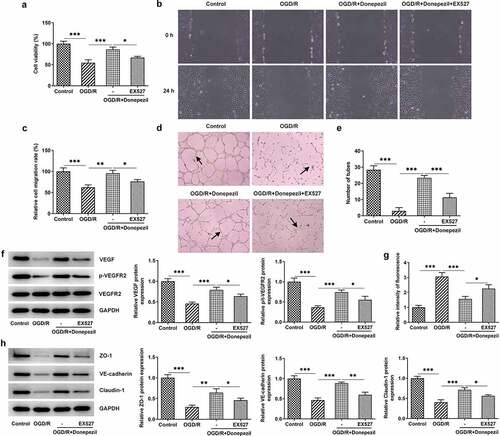
Figure 5. Pretreatment with the SIRT1 inhibitor EX527 reversed the protective effect of Donepezil on OGD/R-induced HBMECs. (a) Cell viability of HBMECs in the groups of OGD/R, OGD/R+ Donepezil and OGD/R+ Donepezil+EX527 was assessed with the help of CCK-8. (b-c) The migration capacity of HBMECs in the groups of OGD/R, OGD/R+ Donepezil and OGD/R+ Donepezil+EX527 was detected employing wound healing. (d-e) The angiogenesis of HBMECs was assayed in the groups of OGD/R, OGD/R+ Donepezil and OGD/R+ Donepezil+EX527 by means of tube formation. (f) The expressions of angiogenetic-related proteins VEGF, p-VEGFR2 and VEGFR2 in HBMECs were examined in the groups of OGD/R, OGD/R+ Donepezil and OGD/R+ Donepezil+EX527 by the way of Western blot. (g) The relative fluorescence intensity of HBMECs was measured in the groups of OGD/R, OGD/R+ Donepezil and OGD/R+ Donepezil+EX527 with the application of in vitro permeability test kit. (h) The expressions of related proteins ZO-1, VE-cadherin and Clarudin-1 in HBMECs were determined in the groups of OGD/R, OGD/R+ Donepezil and OGD/R+ Donepezil+EX527 employing Western blot. Results are the mean ± SD. *P < 0.05, **P < 0.01, ***P < 0.001.