
Figures & data
Figure 1. Ferroptosis in mesangial cells was mediated by high glucose (HG). (a) LDH activity. (b) Lipid ROS production. (c) Fe2+ levels. (d) GSH levels. (e) MDA levels. *P < 0.05, **P < 0.01, and ***P < 0.001 vs. NG group. #P < 0.05, ##P < 0.01, and ###P < 0.001 vs. HG group.
Figure 2. Effect of platycodin D (PD) on cell viability. (a) The chemical structure of PD. (b) Cell viability was analyzed following treatment with 0, 1, 2.5, and 5 μM PD. *P < 0.05.
Figure 3. PD inhibited HG-induced ferroptosis. (a) Lipid ROS production. (b) Iron levels. (c) GSH levels. (d) MDA levels. **P < 0.01 and ***P < 0.001 vs. NG group. ##P < 0.01 and ###P < 0.001 vs. HG group. &P < 0.05 vs. HG + PD group.
Figure 4. PD suppressed the death of HK-2 cells. (a) Cell viability. (b) LDH activity. (c–d) Cell death. (e) ACSL4, TFR1, FTH-1, and SLC7A11 levels. **P < 0.01 and ***P < 0.001 vs. NG group. ##P < 0.01 and ###P < 0.001 vs. HG group. &P < 0.05, &&P < 0.01, and &&&P < 0.001 vs. HG + PD group.
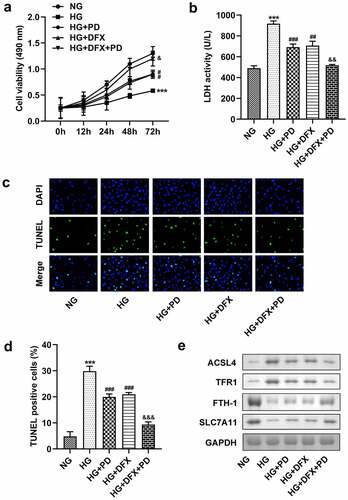
Figure 5. GPX4 expression was low in HG-treated cells. (a) The mRNA expression of GPX4. (b) Western blotting analysis was used to determine GPX4 expression. (c) Quantification of GPX4 expression. **P < 0.01, ***P < 0.001, #P < 0.05, and ##P < 0.01.
Figure 6. GPX4 knockdown promoted HG-induced ferroptosis. (a) GPX4 was measured after transfection. (b) Lipid ROS production. (c) Iron levels. (d) GSH levels. (e) MDA levels. **P < 0.01 and ***P < 0.001 vs. si-nc or NG group. ##P < 0.01 and ###P < 0.001 vs. HG group. &P < 0.05, &&P < 0.01, and &&&P < 0.001 vs. HG + PD + si-nc group.
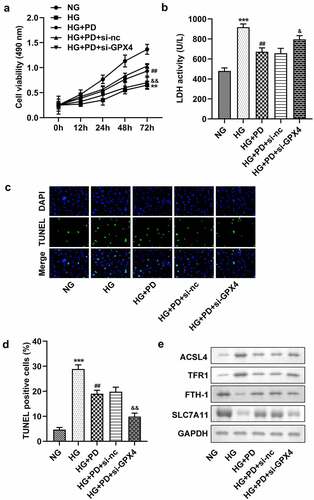
Figure 7. GPX4 knockdown promoted HG-induced cell death. (a) Cell viability. (b) LDH activity. (c–d) Cell death. (e) ACSL4, TFR1, FTH-1, and SLC7A11 levels. **P < 0.01 and ***P < 0.001 vs. si-nc or NG group. ##P < 0.01 vs. HG group. &P < 0.05, &&P < 0.01 vs. HG + PD + si-nc group.
Data availability statement
The datasets used during the current study are available from the corresponding author on reasonable request.